

.
S. Stanley Young, PhD
Assistant Director
Bioinformatics National Institute of Statistical Sciences Research Triangle Park, NC
Are there mortality co-benefits to the Clean Power Plan? It depends.
Some years ago, I listened to a series of lectures on finance. The professor would ask a rhetorical question, pause to give you some time to think, and then, more often than not, answer his question with, “It depends.” Are there mortality co-benefits to the Clean Power Plan? Is mercury coming from power plants leading to deaths? Well, it depends.
So, rhetorically, is an increase in CO2 a bad thing? There is good and bad in everything. Well, for plants an increase in CO2 is a good thing. They grow faster. They convert CO2 into more food and fiber. They give off more oxygen, which is good for humans. Plants appear to be CO2 starved.
It is argued that CO2 is a greenhouse gas and an increase in CO2 will raise temperatures, ice will melt, sea levels will rise, and coastal area will flood, etc. It depends. In theory yes, in reality, maybe. But a lot of other events must be orchestrated simultaneously. Obviously, that scenario depends on other things as, for the last 18 years, CO2 has continued to go up and temperatures have not. So it depends on other factors, solar radiance, water vapor, El Nino, sun spots, cosmic rays, earth presession, etc., just what the professor said.
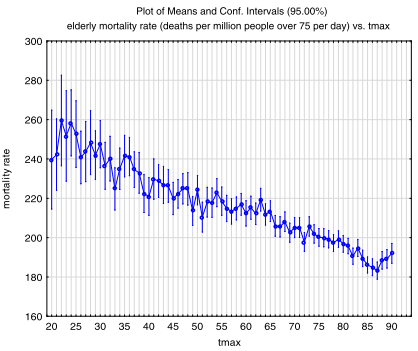
So suppose ambient temperatures do go up a few degrees. On balance, is that bad for humans? The evidence is overwhelming that warmer is better for humans. One or two examples are instructive. First, Cox et al., (2013) with the title, “Warmer is healthier: Effects on mortality rates of changes in average fine particulate matter (PM2.5) concentrations and temperatures in 100 U.S. cities.” To quote from the abstract of that paper, “Increases in average daily temperatures appear to significantly reduce average daily mortality rates, as expected from previous research.” Here is their plot of daily mortality rate versus Max temperature. It is clear that as the maximum temperature in a city goes up, mortality goes down. So if the net effect of increasing CO2 is increasing temperature, there should be a reduction in deaths.
I have a very large California data set. The data covers eight air basins and the years 2000 to 2012. There are 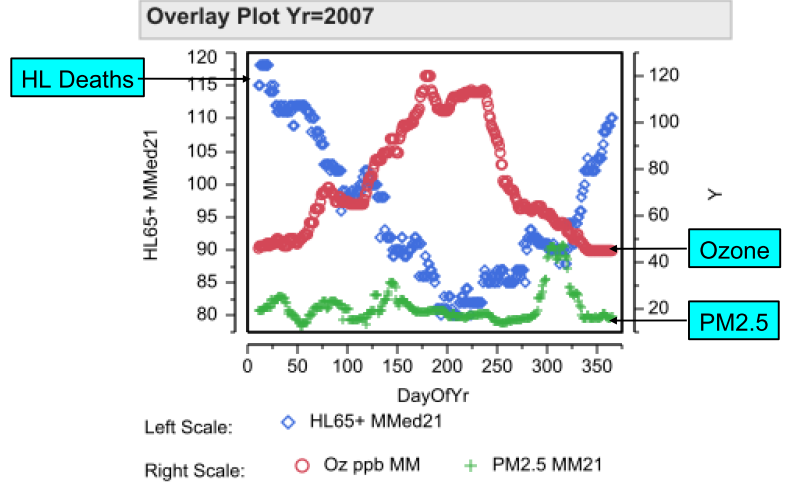 over 37,000 exposure days and over two million deaths. The data for Los Angeles for the year 2007 is typical.
The number of Heart or Lung deaths for people 65 and older are given on the left, y-axis. The moving 21-day median number of deaths are given with blue diamonds as time marches to the right. Deaths are high during the winter, when temperatures are lower; the number of deaths are lower during the summer, when the temperatures are higher. These plots are typical. It is known that higher temperatures are associated with lower deaths.
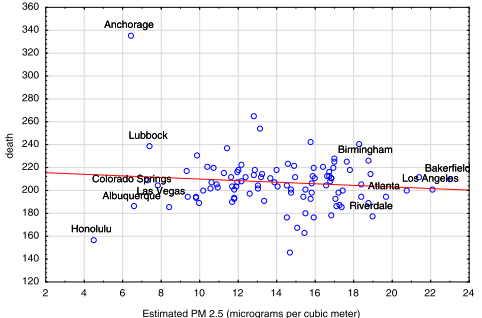
A purported co-benefit of lower CO2 is that there will be lower levels of PM2.5. (PM2.5 is not chemically defined, but is partially made up of combustion products.) It is widely believed that lower levels of PM2.5 will lead to fewer deaths. Here is what Cox et al. (2013) have to say, “Unexpectedly, reductions in PM2.5 do not appear to cause any reductions in mortality rates.” And here is their supporting figure below.
Chay et al. (2003) looked at a reduction in air pollution due to the Clean Air Act. Counties out of compliance were
given stricter air pollution reduction goals. This action by the EPA created a so called natural experiment, Craig et al. (2012). The EPA selected counties did reduce air pollution levels, but there was no reduction in deaths after adjustments for covariates. Chay et al. (2003) say, “We find that regulatory status is associated with large reductions in TSPs pollution but has little association with reductions in either adult or elderly mortality.” So Cox et al. (2013) confirm the finding of Chay et al. (2003) that a reduction in PM2.5 does not lead to a reduction in deaths. Young and Xia (2013) found no assocation of PM2.5 with longevity in western US. Enstrom (2005) and many others have found no association of chronic deaths with PM2.5 in California.
Many claim an association of air pollution with deaths, acute and chronic. How can the two sets of claims be understood? Well, it depends. Greven et al. (2011) say in their abstract, “… we derive a Poisson regression model and estimate two regression coefficients: the “global” coefficient that measures the association between national trends in pollution and mortality; and the “local” coefficient, derived from space by time variation, that measures the association between location-specific trends in pollution and mortality adjusted by the national trends. …Results based on the global coefficient indicate a large increase in the national life expectancy for reductions in the yearly national average of PM2.5. However, this coefficient based on national trends in PM2.5 and mortality is likely to be confounded by other variables trending on the national level. Confounding of the local coefficient by unmeasured factors is less likely, although it cannot be ruled out. Based on the local coefficient alone, we are not able to demonstrate any change in life expectancy for a reduction in PM2.5.” (Italics mine) In plain words, associations measured from location to location, which are likely to be affected by differences in covariates, show an association. Examination of trends within locations, which are less likely to be affected by covariates, show no association. In short, the claims made depend on how well covariates are taken into account. When they are taken into account, Chay et al. (2003), Greven et al. (2011), Cox et al. (2013), Young (2014), there is no association of air pollution with deaths. Chay controls for multiple economic factors. Greven controls for location. Cox controls for temperature. Young controls for time and geography.
Note well: The analysis of Young (2014) uses a moving median within a location (air basin). This analysis is much less likely to be affected by covariates. This analysis finds no assocation of air pollution (PM2.5 or ozone) with deaths. Several figures are instructive. The figures are for LA, but are typical for the other California air basins. First ozone:
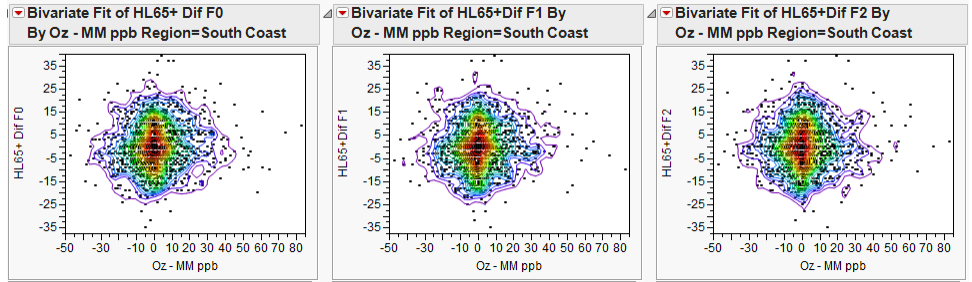
The figures were constructed as follows. From the daily death total was subtracted a 21-day moving median. This calculation corrects for the time trend in the data. From the daily air pollution level the 21-day moving median for the air pollution was subtracted. The daily death “deviation” was plotted against the pollution “deviation”. If air pollution was causing deaths, then the density in these three figures should go from lower left to upper right. To examine if previous air pollution, e.g. yesterday or the day before, was associated with current deaths, lags of 0, 1, and 2 days were used, hence the three figures. Plots like these were computed for all eight air basins; the figures for LA are typical. Next we give the same sort of figures, but for PM2.5. Again, LA.
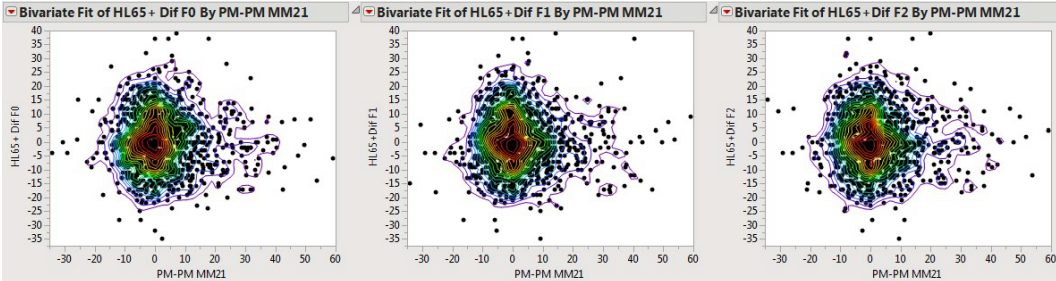
Again, the density is concentrated at zero PM2.5 and zero deaths, and, the important point, there is no tilt of the density from lower left to upper right. And again the plots for LA are typical of the other seven air basins.
Can we say more? Many authors have noted “geographic heterogeneity”, the measured effect of air pollution is not the same in different locations. There is overwhelming evidence for the existence of geographic heterogeneity. See for example, Krewski et al. (2000), Smith et al. (2009), Greven et al. (2011) and Young and Xia (2013). Multiple authors have not found any association of air pollution with acute deaths in California, Krewski et al. (2000), Smith et al. (2009), Young and Xia (2013) and Jarrett et al. (2013). Enstrom (2005) found no association with chronic deaths in California. A careful consideration of of this “geographic heterogeneity” is a key to understanding why it is unlikely that air pollution is causing deaths. Given that geographic heterogeneity exists, how should it be interpreted? First, statistical practice says that if interaction exists, then average effects often are misleading. Any recommendations should be for specific situations. In the words of the finance professor, it depends. In this case it makes no sense to regulate air pollution in California more severely than current regulations.
We can consider the question of interactions of air pollution with geography more deeply. Greven et al. (2011) state in their abstract, “Based on the local coefficient alone, we are not able to demonstrate any change in life expectancy for a reduction in PM2.5.” and they go on to say differences in locations (geographic heterogeneity) is most likely due to differences in covariates, e.g. age distributions, income, smoking. Indeed when Chay et al. (2003) corrected their analysis for an extensive list of covariates, they found no effect of the EPA intervention to reduce air pollution.
There is empirical evidence and a logical case that air pollution is (most likely) not causally related to acute deaths. Heart attacks and stroke were recently removed as a possible etiology, Milojevic et al. (2014).
Economics on the back of an envelope
The EPA claims saving 6,600 deaths per year due to CPP. They value each death at nine million dollars giving a co-benefit of $59.4B. But analysis that takes covariates into consideration finds no excess deaths due to ozone or PM2.5. The $59.4B co-benefit is the result of flawed analysis. And what is the cost of the regulation? The EPA says CPP is the most costly regulation it has considered and puts the cost at up to $90B/yr. The National Manufacturers Association puts the cost at $270B/yr, $900/person/year in 2020.
Consider Figure 4b of Young and Xia (2013). The data used in this figure is that used in Pope, Ezzati, and Dockery (2009) and was kindly provided by Arden Pope III. Change in income and air pollution 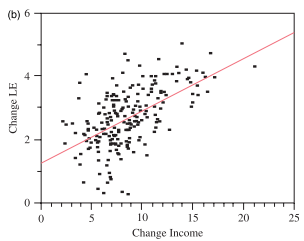 from ~1980 to ~2000 was used. Income in thousands of dollars increase over that time period, but differed in magnitude from city to city, the x-axis. Life expectancy increased as well, y-axis. The general trend is very clear, increased income is associated with increased life expectancy. The income-life expectancy relationship is well-known. See the dramatic video by Hans Rosling (2010). To the extent that regulations are expensive, they should move people down and left in this figure with life expectancy less than it would have been. For example, $900 less income is expected to reduce life expectancy by two months.
So, do you want the EPA CPP regulations to extend your life not at all, costing you $900/yr or do you want to have use of your own money and save two months of your life? It depends. EPA decides or you decide.
Summary
- Increased CO2 is good for plants as plants grow better with increased CO2.
- Increases in temperature, however caused, are good for humans as they are less likely to die.
- The science literature, when covariates are controlled, is on the side that increased ozone and PM2.5 are not associated with increased deaths.
- On balance, the costs of reducing CO2, PM2.5 and ozone are expected to lead to reduced life expectancy.
References:
Chay K, Dobkin C, Greenstone M. (2003) The Clean Air Act of 1970 and adult mortality. J Risk Uncertainty 27, 279-300.
Cox LA Jr, Popken DA, Ricci PF. (2013b) Warmer is healthier: effects on mortality rates of changes in average fine particulate matter (PM2.5) concentrations and temperatures in 100 U.S. cities. Regul Toxicol Pharmacol. 66, 336-346.
Craig P, Cooper C, Gunnell D, Haw S, Lawson K, Macintyre S, Ogilvie D, Petticrew M, Reeves B, Sutton M, Thompson S. (2012) Using natural experiments to evaluate population health interventions: new Medical Research Council guidance. J Epi Community Health. 66,1182-1186.
Enstrom JE. (2005) Fine particulate air pollution and total mortality among elderly Californians. 1973–2002, Inhalation Toxicology 17, 803-816.
Greven S, Dominici F, Zeger S. (2011) An approach to the estimation of chronic air pollution effects using spatio-temporal information. J Amer Stat Assoc. 106, 396-406.
Jerrett M. (2010) California-specific Studies on the PM2.5 Mortality Association. See slides 12 and 13, no increase in “All causes” death rate, http://www.arb.ca.gov/research/health/pm-mort/jerrett.pdf.
Krewski D, Burnett RT, Goldberg MS, Hoover K, Siemiatycki J, Jerrett M, Abrahamowicz M, White WH. (2000) Reanalysis of the Harvard Six Cities Study and the American Cancer Society Study of Particulate Air Pollution and Mortality. Part II: Sensitivity Analysis, HEI Publications. http://pubs.healtheffects.org/view.php?id=6, See Figure 21, in particular.
Milojevic A, Wilkinson P, Armstrong B, Bhaskaran K, Smeeth L, Hajat S. (2014) Short-term effects of air pollution on a range of cardiovascular events in England and Wales: case-crossover analysis of the MINAP database, hospital admissions and mortality. Heart 100, 1093-1098.
Pope III CA, Ezzati E, Dockery DW. (2009) Fine particulate air pollution and life expectancy in the United States, N Engl J Med 360, 376-386.
Rosling H. (2010) 200 countries, 200 years, 4 minutes. http://www.youtube.com/watch?v=jbkSRLYSojo
Smith RL, Xu B, Switzer PP. (2009) Reassessing the relationship between ozone and short-term mortality in U.S. urban communities. Inhal Toxicol 29(S2), 37-61.
Young SS, Xia JQ. (2013) Assessing geographic heterogeneity and variable importance in an air pollution data set. Statistical analysis and data mining. 6, 375-386.
Young SS. (2014) Air pollution and daily deaths in California. Proceedings, 2014 Discovery Summit. https://community.jmp.com/docs/DOC-6691/
NOTE FROM MAYO: I invited Stan Young for an update on his work on this. I let guest posters defend their own arguments, if they wish. A little challenge for a Saturday night.


")


Stan: Thanks so much for this guest post. I would prefer to use my own money to save 2 months of my life rather than have the EPA/CPP regulations charge me $900 a year for nothing. So what’s EPA’s reaction to your analysis? Is it getting in the way of approving your Pre-check application at airports?
No reaction as yet.
“Increases in average daily temperatures appear to significantly reduce average daily mortality rates, as expected from previous research.” Here is their plot of daily mortality rate versus Max temperature. It is clear that as the maximum temperature in a city goes up, mortality goes down. So if the net effect of increasing CO2 is increasing temperature, there should be a reduction in deaths.”
“Increases in temperature, however caused, are good for humans as they are less likely to die.”
Is this supposed to an example of philosophy of science, applied? I don’t find these arguments convincing at all. This is a example of if you can’t make a compelling case for causal identifiability, neither frequentist or bayesian data procedures will save your argument.
vl: These are Young’s arguments. I asked him for an update on the work he’s been doing on this, and he was good enough to send this. I let guest posters defend themselves, if they so choose.
That longevity increases with income is an observation. Obviously it is not money per se; it is what can be done with money. I suggest looking at the Rosling video.
I’m sorry, but I have to call bullshit on this post. You say that temperatures have not risen over the last 18 years. Bullbunger.
The summary:
1. Plants eat carbon dioxide, so carbon dioxide is good. Sounds like a propaganda message rather than a careful scientific statement. Which plants? All plants? Crop plants? Evidence? What about the changes to the distribution of acceptable climates that come from the climate change that comes from increasing levels of carbon dioxide?
2. Increased temperatures will lead to fewer human deaths. Come on. Which humans? Where? What about the increased deaths from stronger, more frequent storms? What about those who live on islands and coastal regions that are being inundated by the sea? What about those who will become exposed to malaria as a consequence of the increased range of the malaria mosquitoes? Think a bit harder.
3. PM2.5 and ozone do not cause deaths. Come on. Speak to a respiratory physician. Your conclusions 1 and 2 lead me to mistrust this conclusion.
4. The costs of reducing CO2, ozone and PM2.5 pollution outweigh the benefits. Well, obviously if you do not account for all of the benefits you might come to a conclusion that is misleading.
Is it just a coincidence that the graphs all look like The Eye of Sauron? I think not 😉
Mayo, you should keep better company than this bloke.
It is something of an embarrassment to the modeling community, but world average temperatures have have not increase since about 1998.
Really, we are stuck going over the “no warming since ’98” idiocy again? Please refer to http://www.realclimate.org or any of the links on the blogroll if want a thorough explanation of how this particular claim is complete bunk.
@Mayo: It ought to be embarrassing for such statistical garbage to be peddled on a blog that claims to take serious problems of inference and uncertainty.
If we really want to get a sense of why global surface temperature average hasn’t peaked above 1998 El-Nino event, lets check in with NOAA. http://www.climate.gov/news-features/climate-qa/why-did-earth%E2%80%99s-surface-temperature-stop-rising-past-decade A combination of natural variability and the oceanic heat-sink act to keep the average surface temperature from reaching a previous high.
The invocation of “no warming since ’98” is a serious red-flag.
I’d put a graph here but do not know how. See http://www.bom.gov.au/climate/updates/articles/a005-sep-2013-warmest-on-record.shtml for access to the entire climate record for Australia. 2013 was the warmest year on record. So much for no warming since 1998.
You do not answer my other criticisms, but I am not expecting that you will.
Mayo, please don’t do this again.
S Stanley Young is associated with the Heartland Institute.
He draws heavily on the paper by LA Cox, who is a risk analysis consultant. His clients in the past have included Philip Morris International, the American Petroleum Institute, the Chemical Manufacturers Association, the Western Oil and Gas Association, to name a few.
If you chase down the Cox reference, he provides his data set. In contrast, most researchers funded by the EPA will not provide their data sets. So we have verifiable on one side and trust me science on the other.
Stan: You know, not declaring your conflicts of interest at the outset doesn’t exactly scream “trust me”.
And as should be well known round here, analyses without honest assessments of severity don’t exactly scream “believe me” either.
But hey, enjoy your trolling.
George: What exactly is Stan’s alleged conflict of interest? I think I must have missed that.
Having lived in Los Angeles since 1978 I can tell you that the air quality has improved tremendously–at times it was so bad that children were not allowed to go out to recess I mention this because I suspect that the same type of analysis done in 1978 with the same type of data would have shown no improvement in health.
The other major omission from this argument is the use of single-market micro analysis. First, the development of technologies for cleaning the air has applications in other fields and various positive externalities. For example, requiring cars to run cleaner caused auto manufacturers to make the engines more efficient which uses less gasoline–less gasoline not only cleans the air but also reduces American dependence on foreign oil, leading to fewer foreign wars to protect our energy sources and also helping us vis-a-vis our geopolitical adversaries, as the world price of oil goes down. Second, their is an assumption that the $900 is a complete loss, which overlooks the macro contribution of increased spending on the economy which would reduce this loss. In the 1950’s, US defense spending was roughly 10% of GDP, yet the economy prospered, whereas before WWII, the economy had been in the dumps with a much smaller percent of GDP military spending. An argument can be made that it was the increased government spending which prevented the relapse into another depression. So that 10% of GDP actually made pretty much every American better off than they would have been had defense spending been about 1% of GDP, yet a non-macro analysis would indicate exactly the opposite.
There is also the moral suasion argument, which is that entities that create negative externalities should be required to mitigate the effects of this, even if an exact harm can not be shown to any individual (if I dump perchlorate behind my house I should be required to clean it up, even if no one can show it caused a cancer case).
Another point is that even if direct health results for reducing pollution cannot be shown through typical statistical techniques there are still a large number of reasons for reducing pollution of all types (and speaking of typical statistical techniques, has anyone even shown that the reduction of smoking rates in America has increased life expectancy overall?). Many of the effects of pollution abatement may not show up for decades–take, as an example, the application of lead abatement programs for low-income housing and the very high correlation with a decrease in crime rates (and this involves geographic heterogeneity in spades). It took decades for that to be picked up.
Anyway, it depends, but certainly on more things than Young considers.
I am not entirely sure of the point that Dr. Young is trying to make. By that I mean, it isn’t entirely clear if he intended to argue that there are really “co-benefits”, of if he intended to present a more pedagogical position that one could see “co-benefits” if they looked at the data a certain way.
Every single example presented here is one of correlation. So, if the term “co-benefit” is intended as a real thing, then I am afraid this is simply confusing correlation for causation.
However, if Dr. Young is trying to point out that the world is complicated, and it is possible to see what look like “co-benefits” if we are not careful in our analysis, then yes, that is an interesting point. But, then the pedagogical point has been made many times that correlation != causation. [here is a list of some cool spurious correlations]
On a side note, anyone who really believes in the actual likelihood of such “co-benefits” should be asked a simple question: Would they live in a house with high levels of CO2, ozone, heat and air pollution? If the answer is yes, then cool. If the answer is no, then that is interesting.
Finally, I completely agree with ‘kenmccue’ that what needs to happen is a macro-level analysis. If our search is too myopic, we could also argue that a chain-saw can be useful for shaving beards.
the list of spurious correlations :):
http://www.replicatedtypo.com/resources/spurious-correlations
kenmccue: EPA and CARB justification of their regulations is on the decrease in deaths. Yes, air quality has improved greatly over the last 30 years. Data for 2000-2012 in California does not support an association of air pollution with deaths. They are free to use some other justification.
I thought that controlling CO2 was intended for controlling climate change and not mortality. Is Dr. Young questioning that as well?
Shorter: Now even if dumping tens of gigatons of carbon into the atmosphere a year is contributing to a warming planet, which I assure you it isn’t, it will actually make us all better off. No really, I swear. Pay no attention to the people who actually know what they are talking about. Remember, kids love the sweet smell of toxic ozone when playing in their hypothetical jungle playgrounds.
‘Shorter’ concept created by Daniel Davies and perfected by Elton Beard. I am aware of all Internet traditions.™
What a sad, sad summary indeed.
1. Increased CO2 is good for plants as plants grow better with increased CO2.
So it’s the plants that have received short shrift in all of our considerations. The selfish analyses of people concerned about global warming were sentencing vegetables to death. How did I not see this?
2. Increases in temperature, however caused, are good for humans as they are less likely to die.
Apparently a hotter planet will allow even more people to inhabit it. Who knew? Venus, therefore, should be a great place for astronauts to set up shop.
3. The science literature, when covariates are controlled, is on the side that increased ozone and PM2.5 are not associated with increased deaths.
The inhabitants of Beijing are being misled, once again, by their misguided Communist masters. Let Beijing stew in coal dust! It’s good for them. The Beijing Olympics would have been better had the city residents not curtailed their polluting ways before the grand event. Mexico City should abandon its misguided cleanup efforts forthwith, and the residents of LA should demand the dirty air they once enjoyed before those statistically unsavvy politicians passed legislation to clean up the air, thereby shortening the lives of their citizenry.
4. On balance, the costs of reducing CO2, PM2.5 and ozone are expected to lead to reduced life expectancy.
Well that’s it, you see. Cavemen, breathing all that fresh air lower in CO2, PM2.5 and ozone, lived short, brutish lives.
Nothing like severely tested evidence to set us all straight. I’m so grateful for sound statistical analysis, clearly demonstrated, by such a fine award winning scholar, at this important time as we stand at the crossroads of the global climate change dilemma. This reasoning should do much to dispel the old saw of “Lies, damn lies, and statistics”.
Steven: Stan Young has been an excellent critic of many of the current flaws and foibles based on statistics, recall for example, his insights on the Potti case. He was one of the first people to develop computerized techniques for dealing with multiple testing. I knew he was working on pollution data and was curious as to what he found–precisely because the results, some of them, seemed surprising. The summary statements are provocative, and are obviously intended to be qualified. I take it that Young is simply looking at the alleged claims by the EPA. Are the EPA’s scientific inferences outside the realm of evidential challenge? He says they don’t make their data available.
Dr. Young may have done perfectly admirable work in bioinformatics but he seems profoundly out of his depth when discussing impacts of climate change.
Summary #1 is a laughable red-herring. And if we are going to talk about carbon sinks, the fact that some plants can handle higher atmospheric CO2 concentrations in no way balances out the massive amounts of carbon being dumped into the atmosphere and the removal of large forests as a carbon sink.
Is he taking credit for multiple testing adjustments now?
Personally, I would say that bioinformatics/genomics is a case study in the misuse of multiple testing to cover up what’s fundamentally a base rate consideration. Nevertheless, among people who take the issue seriously, you will not hear the name Stan Young used alongside Bonferroni, Benjamini, Hochberg, Storey, Efron.
Criticizing Potti isn’t exactly difficult. He says “The statistical methods are complicated. It takes an expert to evaluate an expert.” Honestly, the issue of separating training and test data is so elementary there are high school students in Kaggle competitions who could point out the error. Also, like Potti, this analysis strikes me as yet an example of yet another overconfident bioinformatician reaching beyond his depth in statistics.
vl: I don’t recall anyone saying Young was taking credit for multiple testing adjustments. You are likely not aware of his book with Westfall in 1993.
You wrote: “among people who take the issue seriously, you will not hear the name Stan Young used alongside Bonferroni, Benjamini, Hochberg, Storey, Efron”.
Well, you will find several references to Westfall and Young’s book, Resampling-Based Multiple Testing (1993) in chapter 3 of Efron’s Large Scale Inference (2010).
Efron writes: “Westfall and Young’s (1993) book was a notable successor to Miller (1981), showing how modern computation could be used to good effect on multiple testing problems. (Efron, p. 45).
The different types of train and test, and validation methods for model development, selection, and assessment are complex and scarcely merely a matter of separating out training & test samples. The Potti-type model has yet to have its error probabilities figured out, and I get the impression that the properties of ever-changing methodologies in this arena are similarly unknown.
@Mayo: No one, I expect, is claiming that EPA supported research is immune to challenge.
The fact that Dr. Young makes patently false empirical claims, uses red-herrings and non-sequitors in this post, makes it perfectly reasonable for myself or anyone else to question whether he is an honest participant in this discussion.
West and others: Stan Young has responded to several of the comments in a collected response with names indicated because it is often so hard to line up one’s response under the comments on the blog.
Here are some responses to different commentators:
kenmccue
“Second, there is an assumption that the $900 is a complete loss, which overlooks the macro contribution of increased spending on the economy which would reduce this loss.”
A Milton Freedman story comes to mine.
At one of our dinners, Milton recalled traveling to an Asian country in the 1960s and visiting a work site where a new canal was being built. He was shocked to see that, instead of modern tractors and earth movers, the workers had shovels. He asked why there were so few machines. The government bureaucrat explained: “You don’t understand. This is a jobs program.” To which Milton replied: “Oh, I thought you were trying to build a canal. If it’s jobs you want, then you should give these workers spoons, not shovels.”
So if it just a question of getting money into the economy, just rebated $900 to everyone.
“…even if direct health results for reducing pollution cannot be shown through typical statistical techniques there are still a large number of reasons for reducing pollution…”
So the EPA should use those reasons and not scare people that they are going to die.
karthik
The EPA is arguing that a co-benefit is a reduction in deaths. Given the current air quality, that is a dubious claim.
CO2 is not toxic to humans and is beneficial to plants. Humans breath out 4% CO2. In nuclear submarines 8,000 ppm CO2 is OK, about 20 time current atmospheric levels.
Sure, increased income does not “cause” increased longevity. It is just with money you can do lots of things that end up increasing longevity. Can the individual do that better than the government? Mostly yes, but it depends.
newguest
Data on this point is in. Over the last 15 years CO2 has increased by 10% and temperature has not increased. I’m told that CO2 keeps in certain wave lengths and progressively is less effective as the concentration goes up. The EPA claim is a good story as far as it goes, but it depends on saturation effects.
Steven McKinney
You seem to have missed the point, IT DEPENDS on the level. The London Smog of December 1952 killed several thousand. As I find no association of air pollution and acute deaths in LA, I’m in the market for Beijing data.
West
CO2? I spent a year or so reading a book with an e friend. He was skeptical of the book, Heaven and Earth by Plimer, 490 pages and 2311 references. I must say some of the things had me scratching my head too. Was Plimer accurately presenting the material in his references? I though he was. We struck a deal. I selected 100 references at random from the 2311. We were able to secure pdfs of about 90 of the references. He read the references and if he was unsure, I would read the reference. Together we decided that only 2 or 3 might have been slanted in the reporting in the book (or the topic was outside our ability to decide). Basically, we decided that he was fair. Plimer takes the position that climate change is cyclical and humans have little influence. “In previous times, atmospheric carbon dioxide was far higher that at present but did not drive climate change.”
My target is the EPA and their claim that current levels of air pollution are killing massive numbers of people. Data and analysis indicates it is not happening in California
The choice was framed (in the original post) as:
So, do you want the EPA CPP regulations to extend your life not at all, costing you $900/yr or do you want to have use of your own money and save two months of your life? It depends. EPA decides or you decide.
I was pointing out that the evidence for this concluding paragraph was insufficient for various macro reasons (it might also be noted that inferring causality from a scattergram of income versus life expectancy violates everything statisticians and philosophers have been arguing about for the last 50 years, and hence makes this argument also suspect). Regarding the Freedman example, Keynes originally pointed out it was better to be digging holes in the ground and filling them in rather than let the economy persist at a sub-optimal equilibrium, so Freedman’s surprise was disingenuous–he was well aware that government spending could help an economy in a depressed state. Would it be better to have more effective means of building the canal (i.e., machinery)? Other things being equal, to be sure, but given the shortage of foreign exchange in Asian economies in the 60’s made certain that other things were not equal. As far as giving money directly–sure, that would be helpful (Freedman suggested dumping money out of helicopters to cure a depression). There are political reasons why this won’t occur, of course (think Ryan’s comments about the safety net being a hammock). As far as a more honest intellectual argument for controlling pollution, EPA is limited to providing arguments with a basis in its enabling legislation. That does not mean that outside commentators (such as yourself) cannot be aware of them and note them, since it falls well under the purview of “it depends.” The “it depends” choice in your above paragraph is quite incomplete and that was the point I was making. My other main point (not addressed in your reply) is whether any statistical techniques would show an improvement in health by controlling pollution even given the levels of pollution we saw in the 50’s and 60’s in this country (smog so bad you couldn’t see three blocks, rivers catching on fire, etc). The direct implication of your argument is that if the techniques can’t pick this up then don’t do it, and it shouldn’t have been done 50 years ago. Yet by pretty much every standard our country is much cleaner (and healthier) than it was 50 years ago.
The larger point is statisticians seem to feel that they have a particular insight into public policy matters. While policy must be informed by evidence (including statistics) there are always other considerations at play. A simple summarizing of the various statistical arguments for and against certain EPA standards would be useful. The implications for public policy are much more complex and statisticians run the risk of coming off as ideologues (usually right, but sometimes left–consider the Coleman report and the consequent school busing–this is somewhat unfair to Coleman who later repudiated the application of his original report, since it confused correlation with causality) when they start making pronouncements without the proper qualifications.
“is whether any statistical techniques would show an improvement in health by controlling pollution”
Chay et al. carefully examined a situation where counties were forced to reduce air pollution. Pollution levels decreased and there was no improvement in death rate. Read that paper for details.
Some items Young had shared about recent bizarre fraud committed by one of the senior guys at EPA, Beale (now in jail).
Click to access beal-fraud-wsj.pdf
Click to access beale-lois-henry1.pdf
It is indeed unfortunate that such a disturbed individual took advantage of his power and position to relieve tax payers of close to a million dollars. John Beale was sentenced to 32 months in prison, and ordered to pay more than 1 million in restitution. It is also unfortunate that people jump up and down on government – our attempt to deal with the problems that affect us collectively – when something such as this fiasco unfolds. I am not ready to ditch the EPA because one poorly chosen executive went nuts. Of course his work should be vetted and retracted where needed.
If people were similarly outraged when for example the executives of Goldman-Sachs relieved millions of people from around the planet of trillions of dollars, we might get somewhere. I rarely hear people express such indignation when business leaders execute such malfeasance. Very few of those actors have been convicted, certainly not the top executives, and little of that money recovered. Why people give business leaders such a pass, while hammering on government employees, baffles me.
Steven: Well, I wouldn’t blur the cases. I do think it’s outrageous that lots of the financial kingpins weren’t jailed, especially those who committed the exact same abuses after the crash and after the supposed new rules, e.g., Corzine (of “I don’t know where the money went”). In the case of individuals in control of (supposedly) evidence-based policy, the abuse of trust, the looking the other way by others, etc. is even more egregious. (I don’t say Beal’s crimes led in any way to unwarranted EPA rulings, I simply don’t know, having only just heard about it recently.)
The subtle argument in the paper goes in three steps.
1. There is no effect in California, but there are claimed effects in other parts of the country so there is geographic interaction/heterogeneity.
2. Other studies where covariates are controlled have no effect.
3. So the interaction is most likely due to uncontrolled covariates.
Therefore air pollution is not causal of acute deaths.
What do readers think of that?
Yet you state above that “The London Smog of December 1952 killed several thousand.” How then is air pollution not causal of acute deaths?
Mayo: you are well versed in philosophical discourse. You should deconstruct this specious line of “reasoning” presented above.