

.
Stephen Senn
Head of Competence Center
for Methodology and Statistics (CCMS)
Luxembourg Institute of Health
Twitter @stephensenn
Fishing for fakes with Fisher
Stephen Senn
The essential fact governing our analysis is that the errors due to soil heterogeneity will be divided by a good experiment into two portions. The first, which is to be made as large as possible, will be completely eliminated, by the arrangement of the experiment, from the experimental comparisons, and will be as carefully eliminated in the statistical laboratory from the estimate of error. As to the remainder, which cannot be treated in this way, no attempt will be made to eliminate it in the field, but, on the contrary, it will be carefully randomised so as to provide a valid estimate of the errors to which the experiment is in fact liable. R. A. Fisher, The Design of Experiments, (Fisher 1990) section 28.

Fraudian analysis?
John Carlisle must be a man endowed with exceptional energy and determination. A recent paper of his is entitled, ‘Data fabrication and other reasons for non-random sampling in 5087 randomised, controlled trials in anaesthetic and general medical journals,’ (Carlisle 2017) and has created quite a stir. The journals examined include the Journal of the American Medical Association and the New England Journal of Medicine. What Carlisle did was examine 29,789 variables using 72,261 means to see if they were ‘consistent with random sampling’ (by which, I suppose, he means ‘randomisation’). The papers chosen had to report either standard deviations or standard errors of the mean. P-values as measures of balance or lack of it were then calculated using each of three methods and the method that gave the value closest to 0.5 was chosen. For a given trial the P-values chosen were then back-converted to z-scores combined by summing them and then re-converted back to P-values using a method that assumes the summed Z-scores to be independent. As Carlisle writes, ‘All p values were one-sided and inverted, such that dissimilar means generated p values near 1’.
He then used a QQ plot, which is to say he plotted the empirical distribution of his P-values against the theoretical one. For the latter he assumed that the P-values would have a uniform distribution, which is the distribution that ought to apply for P-values for baseline tests of 1) randomly chosen baseline variates, in 2) randomly chosen RCTs 3) when analysed as randomised. The third condition is one I shall return to and the first is one many commentators have picked up, however, I am ashamed to say that the second is one I overlooked, despite the fact that every statistician should always ask ‘how did I get to see what I see?’, but which took a discussion with my daughter to reveal to me.
Little Ps have lesser Ps etc.
Carlisle finds, from the QQ plot, that the theoretical distribution does not fit the empirical one at all well. There is an excess of P-values near 1, indicating far too frequent poorer-than-expected imbalance and an excess of P-values near 0 indicating balance that is too-good-to-be-true. He then calculates a P-value of P-values and finds that this is 1.2 x 10⁻⁷.
Before going any further, I ought to make clear that I consider that the community of those working on and using the results of randomised clinical trials (RCTs), whether as practitioners or theoreticians, owe Carlisle a debt of gratitude. Even if I don’t agree with all that he has done, the analysis raises disturbing issues and not necessarily the ones he was interested in. (However, it is also only fair to note that despite a rather provocative title, Carlisle has been much more circumspect in his conclusions than some commentators.) I also wish to make clear that I am dismissing neither error nor fraud as an explanation for some of these findings. The former is a necessary condition of being human and the latter far from incompatible with it. Carlisle, disarmingly admits that he may have made errors and I shall follow him and confess likewise. Now to the three problems.
Three coins in the fountain
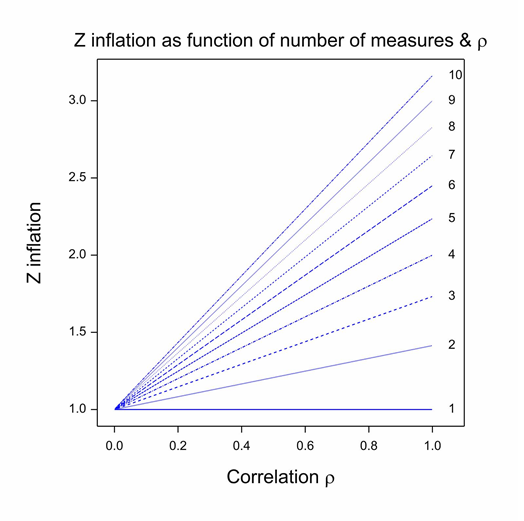
First, there is one decision that Carlisle made, which almost every statistical commentator has recognised as inappropriate. (See, for example, Nick Brown for a good analysis.) In fact, Carlisle himself even raised the difficulty, but I think he probably underestimated the problem. The method he uses for combining P-values only works if the baseline variables are independent. In general, they are not: sex and height, height and baseline forced expiratory volume in one second (FEV1), baseline FEV1 and age are simple examples from the field of asthma and similar ones can be found for almost every indication. The figure shows the Z-score inflation that attends combining correlated values as if they were independent. Each line gives the ratio of the falsely calculated Z-score to what it should be given a common positive correlation between covariates. (This correlation model is implausible but sufficient to illustrate the problem and simplifies both theory and exposition (Senn and Bretz 2007).) Given the common correlation coefficient assumption, this ratio only depends on the correlation coefficient itself and the number of variates combined. It can be seen that unless either, the correlation is zero or the trivial case of 1 covariate is considered, z-inflation occurs and it can easily be considerable. This phenomenon could be one explanation for the excess of P-values close to 0.
 I shall leave the second issue until last. The third issue is subtler than the first but is one Fisher was always warning researchers about and is reflected in the quotation in the rubric. If you block by a factor in an experiment but don’t eliminate it in analysis, the following are the consequences on the analysis of variance. 1) All the contribution in variability of the blocks is removed from the ‘treatment’ sum of squares. 2) That which is removed is added to the ‘error’ sum of squares. 3) The combined effect of 1) and 2) means that the ratio of the two no longer has the assumed distribution under the null hypothesis (Senn 2004). In particular, excessively moderate Z scores may be the result.
Now, it is a fact that very few trials are completely randomised. For example, many pharma-industry trials use randomly permuted blocks and many trials run by the UK Medical Research Council (MRC) or the European Organisation for Research and Treatment of Cancer (EORTC) use minimisation (Taves 1974). As regards the former, this tends to balance trials by centre. If there are strong differences between centres, this balancing alone will be eliminated from the treatment sum of squares effect but not from the error sum of squares, which, in fact, will increase. Since centre effects are commonly fitted in pharma-industry trials when analysing outcomes, this will not be a problem: in fact, much sharper inferences will result. It is interesting to note that Marvin Zelen, who was very familiar with public-sector trials but less so with pharmaceutical industry trials, does not appear to have been aware that this was so, and in a paper with Zheng recommended that centre effects ought to be eliminated in future (Zheng and Zelen 2008) unaware that in many cases they already were. Similar problems arise with minimised trials if covariates involved in minimisation are not fitted (Senn, Anisimov, and Fedorov 2010). Even if centre and covariate effects are fitted, if there are any time trends, both of the above methods of allocation will tend to balance by them (since typically the block size is smaller than the centre size and minimisation forces balance not only by the end of the trial but at any intermediate stage), and if so, this will inflate the error variance unless the time trend is fitted. The problem of time trends is one Carlisle himself alluded to.
Now, tests of baseline balance are nothing if not tests of the randomisation procedure itself (Berger and Exner 1999, Senn 1994). (They are useless for determining what covariates to fit.) Hence, if we are to test the randomisation procedure, we require that the distribution of the test-statistic under the null hypothesis has the required form and Fisher warned us it wouldn’t, except by luck, if we blocked and didn’t eliminate. The result would be to depress the Z-statistic. Thus, this is a plausible possible explanation of the excess of P-values near zero that Carlisle noted since he could not adjust for such randomisation approaches.
Now to the second and (given my order of exposition) last of my three issues. I had assumed, like most other commentators, that the distribution of covariates at baseline ought to be random to the degree specified by the randomisation procedure (which is covered by issue three). This is true for each and every trial looking forward. It is not true for published trials looking backward. The questions my daughter put to me was, ‘what about publication bias?,’ and stupidly I replied, ‘but this is not about outcomes’. However, as I ought to know, the conditional type I error rate of an outcome variable varies with the degree of balance and correlation with a baseline variable. What applies one way applies the other and since journals have a bias in favour of positive results (often ascribed to the process of submission only (Goldacre 2012) but very probably part of the editorial process also) (Senn 2012, 2013), then published trials do not provide a representative sample of trials undertaken. Now, although, the relationship between balance and the Type I error rate is simple (Senn 1989) the relationship between being published and balance is much more complex, depending as it does on two difficult-to- study further things: 1) the distribution of real treatment effects (if I can be permitted a dig at a distinguished scientist and ‘blogging treasure’, only David Colquhoun thinks this is easy); 2) the extent of publication bias.
However, despite having the information we need, it is clear, that one cannot simply expect baseline distribution of published trials to be random.
Two out of three is bad
Which of Carlisle’s findings turn out to be fraud, which error and which explicable by one of these three (or other) mechanisms, remains to be seen. The first one is easily dealt with. This is just an inappropriate analysis. Things should not be looked at this way. However, pace Meatloaf, two out of three is bad when the two are failures of the system.
As regards issue two, publication bias is a problem and we need to deal with it. Relying on journals to publish trials is hopeless: self-publication by sponsors or trialists is the answer.
However, issue three is a widespread problem: Fisher warned us to analyse as we randomise. If we block or balance by factors that we don’t include in our models, we are simply making trials bigger than they should be and producing standard errors in the process that are larger than necessary. This is sometimes defended on the grounds that it produces conservative inference but in that respect I can’t see how it is superior than multiplying all standard errors by two. Most of us, I think, would regard it as a grave sin to analyse a matched pairs design as a completely randomised one. Failure to attract any marks is a common punishment in stat 1 examinations when students make this error. Too many of us, I fear, fail to truly understand why this implies there is a problem with minimised trials as commonly analysed. (See Indefinite Irrelevance for a discussion.)
As ye randomise so shall ye analyse (although ye may add some covariates) we were warned by the master. We ignore him at our peril. MRC & EORTC, please take note.
Acknowledgements
I thank Dr Helen Senn for useful conversations. My research on inference for small populations is carried out in the framework of the IDeAL project http://www.ideal.rwth-aachen.de/ and supported by the European Union’s Seventh Framework Programme for research, technological development and demonstration under Grant Agreement no 602552.
References
Berger, V. W., and D. V. Exner. 1999. “Detecting selection bias in randomized clinical trials.” Controlled Clinical Trials no. 20 (4):319-327.
Carlisle, J. B. 2017. “Data fabrication and other reasons for non-random sampling in 5087 randomised, controlled trials in anaesthetic and general medical journals.” Anaesthisia. doi: 10.1111/anae.13938.
Fisher, Ronald Aylmer, ed. 1990. The Design of Experiments. Edited by J.H. Bennet, Statistical Methods, Experimental Design and Scientific Inference. Oxford: Oxford.
Goldacre, B. 2012. Bad Pharma: How Drug Companies Mislead Doctors and Harm Patients. London: Fourth Estate.
Senn, S., and F. Bretz. 2007. “Power and sample size when multiple endpoints are considered.” Pharm Stat no. 6 (3):161-70.
Senn, S.J. 1989. “Covariate imbalance and random allocation in clinical trials [see comments].” Statistics in Medicine no. 8 (4):467-75.
Senn, S.J. 1994. “Testing for baseline balance in clinical trials.” Statistics in Medicine no. 13 (17):1715-26.
Senn, S.J. 2004. “Added Values: Controversies concerning randomization and additivity in clinical trials.” Statistics in Medicine no. 23 (24):3729-3753.
Senn, S.J., V. V. Anisimov, and V. V. Fedorov. 2010. “Comparisons of minimization and Atkinson’s algorithm.” Statistics in Medicine no. 29 (7-8):721-30.
Senn, Stephen. 2012. “Misunderstanding publication bias: editors are not blameless after all.” F1000Research no. 1.
Senn, Stephen. 2013. Authors are also reviewers: problems in assigning cause for missing negative studies 20132013]. Available from http://f1000research.com/articles/2-17/v1.
Taves, D. R. 1974. “Minimization: a new method of assigning patients to treatment and control groups.” Clinical Pharmacology and Therapeutics no. 15 (5):443-53.
Zheng, L., and M. Zelen. 2008. “MULTI-CENTER CLINICAL TRIALS: RANDOMIZATION AND ANCILLARY STATISTICS.” Annals of Applied Statistics no. 2 (2):582-600. doi: 10.1214/07-aoas151.


")


I’m very grateful to Senn for applying his great store of knowledge to expose or question analyses like this one. A good deal of fraudbusting these days involves applying statistical methods such as p-values to expose questionable or even fraudulent practices, but these meta-methdological statistical inferences also call for scrutiny.
From Carlisle: “There was evidence that trials retracted for reasons other than data integrity may have contained corrupt and possibly fabricated data.” I hope that these authors, already suffering from having had to retract their papers (for whatever reasons), don’t find themselves tied to erroneous suspicions of data fabrication. I once had a blog post “p-value can’t be trusted except when used to argue that P-values can’t be trusted”. I realize that’s not quite what’s going on here, but it’s noteworthy that p-value are important tools in fraudbusting: that’s what makes them capable of self-correction (when used correctly).
On randomization, Senn is the leading expert. It’s telling, as well, how many of these flaws Senn finds articulated in Fisher. (He should write a book, “Everything you need to know about randomization you’d learn from R.A. Fisher”.)
I enjoyed reading Stephen’s post on your blog site. Stephen made some inciteful observations, as have some other commentators.
My aim is to follow standard scientific practice. Differences between data and a model may be due to;
1) chance
2) an ‘incorrect’ model
3) ‘incorrect’ data
When chance seems a poor explanation for differences the correct default is to assume that the model is incorrect.
With Stephen and Nick Brown I assume that the model is incorrect i.e. I also think that many of the model’s assumptions were incorrect for some of the trials to which I applied it, but the question is by how much is the p value affected by the incorrect assumptions in different trials. I listed in my paper a number of assumptions that might be incorrect. One corollary – that Stephen writes about – is that analyses of results in these RCTs might also be incorrect if authors have used tests for significance that have made invalid assumptions.
I stated in my paper that correlation between baseline variables might have caused differences between model and data: I’ve stated this previously and I simulated some of the effects of correlation in the appendices of a 2015 paper: http://onlinelibrary.wiley.com/doi/10.1111/anae.13126/full.
Stephen, along with a couple of other commentators, thinks that I might have underestimated the contribution of correlation to the differences between model and data. I’m unsure how Stephen could discern what I was thinking or why he thought that I had “probably underestimated the problem”. I’ve been quite careful to avoid inferring what I think. If you read through my papers you’ll find that I have avoided statements of belief: I have reported what I did, what I found and some of the possible explanations for the findings.
I also listed blocking and time trends, which Stephen discusses, in addition to stratification, as possible causes for mismatch between data and model. As Stephen states, I couldn’t adjust for these effects (without individual patient data from the trials or some summary measure of their effect), just as I couldn’t adjust for an unknown amount of correlation (again, individual patient data would solve this problem). Rather than make educated guesses for these confounding factors I elected to present the results of a model with assumptions I knew wouldn’t be correct but by how much I knew not. I also applied the test ‘dumbly’, in that I tested data that I ‘knew’ might be correct except for some typographical error (a switch of SEM for SD, or vice versa, or a missed decimal place or an incorrect numeral). Many instances of such errors would be ‘obvious’ to all, but being wary of the boundaries between what is obvious and what is not I decided to allow the model to detect simple error.
And as for publication bias, which Stephen lists last, I haven’t done anything for that problem.
To summarise, my paper isn’t about trying to detect fabrication. It is about testing the performance of a model that might be used to detect fabrication. The model and the data disagreed. One might reasonably assume that most of the data are real and that most of the disagreement between model and data is due to incorrect assumptions in the model. And a small amount of disagreement is due to ‘honest error’. But a tiny bit of difference might, just might, be because of data fabrication. Remember, retracted trials had bigger disagreements with the model than unretracted trials.
John: Thanks so much for your informative comment!
I don’t think John and I disagree on much. Some further comments.
1) It’s not really necessary to simulate to see the effect of correlation.
2) A simple solution to the correlation problem is not to combine the baseline z statistics. It is not obvious to me why John felt the need to combine them.
3) It is not just trend effects that would invalidate randomisation tests. Many trials are multi-centre and most of those are blocked by centre. It is unlikely but theoretically possible that centres would recruit simultaneously. In that case time trends would be irrelevant but a test assuming simple randomisation would still be invalid due to centre effects.
4) John is much more circumspect in his paper than many who picked up on its findings. Nevertheless, the paper illustrates a general scientific problem. Papers that are
merely suggestive have their message transmuted into something much more sensational by those who pick them up. It will be interesting to revisit the whole story once the dust settles.
5) Whatever the explanation for the findings in the paper, they have implications for the way we analyse outcomes. To make that point was the main objective of my comment
Stephen: Very well written!
Keith O’Rourke