
 Personal perils: are numbers needed to treat misleading us as to the scope for personalised medicine?

A common misinterpretation of Numbers Needed to Treat is causing confusion about the scope for personalised medicine.
Stephen Senn
Consultant Statistician,
Edinburgh
Introduction
Thirty years ago, Laupacis et al1 proposed an intuitively appealing way that physicians could decide how to prioritise health care interventions: they could consider how many patients would need to be switched from an inferior treatment to a superior one in order for one to have an improved outcome. They called this the number needed to be treated. It is now more usually referred to as the number needed to treat (NNT).
Within fifteen years, NNTs were so well established that the then editor of the British Medical Journal, Richard Smith could write: ‘Anybody familiar with the notion of “number needed to treat” (NNT) knows that it’s usually necessary to treat many patients in order for one to benefit’2. Fifteen years further on, bringing us up to date, Wikipedia makes a similar point ‘The NNT is the average number of patients who need to be treated to prevent one additional bad outcome (e.g. the number of patients that need to be treated for one of them to benefit compared with a control in a clinical trial).’3
This common interpretation is false, as I have pointed out previously in two blogs on this site: Responder Despondency and Painful Dichotomies. Nevertheless, it seems to me the point is worth making again and the thirty-year anniversary of NNTs provides a good excuse.
NNTs based on dichotomies, as opposed to those based on true binary outcomes (which are very rare), do not measure the proportion of patients who benefit from the drug and even when not based on such dichotomies, they say less about differential response than many suppose. Common false interpretations of NNTs are creating confusion about the scope for personalised medicine.
Not necessarily true
To illustrate the problem, consider a 2015 Nature comment piece by Nicholas Schork4 calling for N-of-1 trials to be used more often in personalising medicine. These are trials in which, as a guide to treatment, patients are repeatedly randomised in different episodes to the therapies being compared. 5.
NNTs are commonly used in health economics. Other things being equal, a drug with a larger NNT ought to have a lower cost per patient day than one with a smaller NNT if it is to justify its place in the market. Here however, they were used to make the case for the scope for personalised medicine, and hence the need for N-of-1 trials, a potentially very useful approach to personalising treatment. Schork claimed, ‘The top ten highest-grossing drugs in the United States help between 1 in 25 and 1 in 4 of the people who take them (p609). This claim may or may not be correct (it is almost certainly wrong) but the argument for it is false.
The figure: Imperfect medicine is based on Schork’s figure Imprecision medicine and shows the NNTs for the ten best selling drugs in the USA at the time of his comment. The NNTs range, for example, from 4 for Humira® in arthritis to 25 for Nexium in heartburn. This is then interpreted as meaning that since, for example, on average 4 patients would have to be treated with Humira rather than placebo in order to get one more response, only one in 4 patients responds to Humira.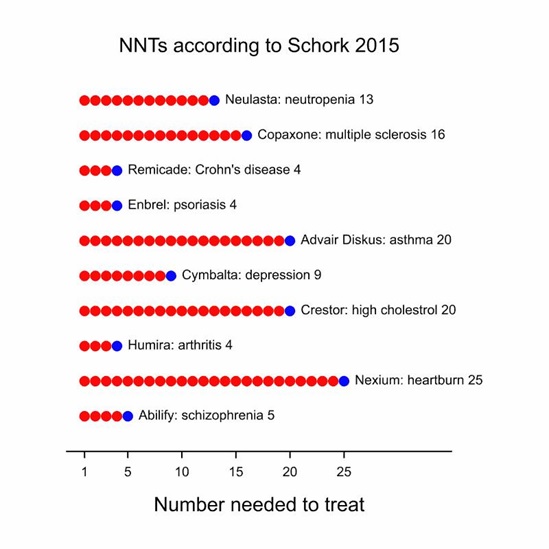 Imperfect medicine: Numbers Needed to Treat based on a figure in Schork (2015). The total number of dots represents how many patients you would have to switch to the treatment mentioned to get one additional response (blue dot). The red dots are supposed to represent the patients for whom it would make no difference.
Take the example of Nexium. The figure quoted by Schork is taken from a meta-analysis carried out by Gralnek et al6 based on several studies comparing Esomeprazole (Nexium) to other protein pump inhibitors. The calculation of the NNT may be illustrated by taking one of the studies that comprise the meta-analysis, the EXPO study reported by Labenz et al7 in which a clinical trial with more than 3000 patients compared Esomeprazole to Pantoprazole. Patients with erosive oesophagitis were treated with either one or the other treatment and then evaluated at 8 weeks.
Of those treated with Esomeprazole 92.1% were healed. Of those treated with Pantoprazole 87.3% were healed. The difference of 4.8% is the risk difference. Expressed as a proportion this is 0.048 and the reciprocal of this figure is 21, rounded up to the nearest whole number. This figure is the NNT and an interpretation is that on average you would need to treat 21 patients with Esomeprazole rather than with Pantoprazole to have one extra healed case at 8 weeks. For the meta-analysis as a whole, Gralnek et al6 found a risk difference of 4% and this yields an NNT of 25, the figure quoted by Schork. (See Box for further discussion.)
Two different interpretations of the EXPO oesophageal ulcer data
It is impossible for us to observe the ulcers that were studied in the EXPO trial under both treatments. Each patient, was treated with either Esomeprazole or Pantoprazole. We can imagine what response would have been on either but we can only observe it on one. Table 1 and Table 2 have the same observable marginal probabilities of ulcer healing but different postulated joint ones.
Table 1 Possible joint distribution of response (percentages) for the EXPO trial. Case where no patient would respond on Pantoprazole who did not on Esomeprazole In the case of Table 1, no patient that would not have been healed by Esomeprazole could have been healed by Pantoprazole. In consequence the total number of patients who could have been healed are those who were healed with Esomeprazole, that is to say 92.1%. In the case of Table 2, all patients who were not healed with by Esomeprazole, that is to say 7.9%, could have been healed by Pantoprazole. In principle it becomes possible to heal all patients. Of course, intermediate situations are possible but all such tables have the same NNT of 21. The NNT cannot tell us which is true.
Table 2 Possible joint distribution of response (percentages) for the EXPO trial. Case where all patients did not respond on Esomeprazole would respond on Pantoprazole
|
||||||||||||||||||||||||||||||||||||||||||||||||
A number of points can be made taking this example. First, it is comparator-specific. Proton pump inhibitors as a class are highly effective and one would get quite a different figure if placebo rather than Pantoprazole had been used as the control for Esomeprazole. Second, the figure, of itself, does not tell us the scope for personalising medicine. It is quite compatible with the two extreme positions given in the Box. In the first case, every single patent who was helped by Pantoprazole would have been so by Esomeprazole. If there are no cost or tolerability advantages to the former the optimal policy would be to give all patient the latter. In the second case, every single patient who was not helped by Esomeprazole would have been helped by Pantoprazole. If a suitable means can be found of identifying such patients, all patients can be treated successfully. Third, healing is a process that takes time. The eight-week time-point is partly arbitrary. The careful analysis presented by Labenz et al7 shows healing rates rising with time with the Esomeprazole rate always above that for Pantoprazole. Perhaps with time, either would heal all ulcers, the difference between them being one of speed. Fourth, although it is not directly related to this discussion, it should be appreciated that a given drug can have many NNTs. The NNT will vary both according to the comparator, the outcome chosen, the cut point for any dichotomy or the follow-up8. (The original article proposing NNTs by Laupacis et al1 discusses a number of such caveats.) Indeed, for the EXPO study the risk difference at 4 weeks is 8.7 with an NNT of rather than 21 for 8 weeks. This shows the importance of not mixing NNTs for different follow-ups in a meta-analysis.
An easy lie or a difficult truth?
There are no shortcuts to finding evidence for variation in response9. Dichotomising continuous measures not only has the capacity to exaggerate unimportant differences it is also inefficient and needlessly increases trial sizes10.
Rather than becoming simpler, ways that clinical trial are reported need to be more nuanced. In a previous blog I showed how a NNT of 10 for headache had been misinterpreted as meaning that only 1 in 10 benefitted from paracetamol. It is, or ought to be obvious, that in order to understand the extent to which patients respond to paracetamol you should study them more than once under treatment and under control. For example, a design could be employed in which each patient was treated for four headaches, twice with placebo and twice with paracetamol. This is an example of the n-of-1 trials than Schork calls for4. We hardly ever run these. Of course for some diseases they are not practical but where we can’t run them, we should not pretend to have identified what we can’t.
The role for n-of-1 trials is indeed there but not necessarily to personalise treatment. More careful analysis of response may simply reveal that this is less variable than supposed11. In some cases such trials may simply deliver the message that we need to do better for everybody12.
In his editorial of 2003 Smith referred to pharmacogenetics as providing ‘hopes that greater understanding of genetics will mean that we will be able to identify with a “simple genetic test” people who will respond to drugs and design drugs for individuals rather than populations.’ and added, ‘We have, however, been hearing this tune for a long time’2.
Smith’s complaint about an old tune is as true today as it was in 2003. However, the message for the pharmaceutical industry may simply be that we need better drugs not better diagnosis.
Acknowledgement
I am grateful to Andreas Laupacis and Jennifer Deevy for helpfully providing me with a copy of the 1988 paper.
References
- Laupacis A, Sackett DL, Roberts RS. An Assessment of Clinically Useful Measures of the Consequences of Treatment. New England Journal of Medicine 1988;318(26):1728-33.
- Smith R. The drugs don’t work. British Medical Journal 2003;327(7428).
- Wikipedia. Number needed to treat 2018 [Available from: https://en.wikipedia.org/wiki/Number_needed_to_treat.
- Schork NJ. Personalized medicine: Time for one-person trials. Nature 2015;520(7549):609-11.
- Araujo A, Julious S, Senn S. Understanding Variation in Sets of N-of-1 Trials. PloS one 2016;11(12):e0167167.
- Gralnek IM, Dulai GS, Fennerty MB, et al. Esomeprazole versus other proton pump inhibitors in erosive esophagitis: a meta-analysis of randomized clinical trials. Clin Gastroenterol Hepatol 2006;4(12):1452-8.
- Labenz J, Armstrong D, Lauritsen K, et al. A randomized comparative study of esomeprazole 40 mg versus pantoprazole 40 mg for healing erosive oesophagitis: the EXPO study. Alimentary pharmacology & therapeutics 2005;21(6):739-46.
- Suissa S. Number needed to treat: enigmatic results for exacerbations in COPD. The European respiratory journal : official journal of the European Society for Clinical Respiratory Physiology 2015;45(4):875-8.
- Senn SJ. Mastering variation: variance components and personalised medicine. Statistics in Medicine 2016;35(7):966-77.
- Royston P, Altman DG, Sauerbrei W. Dichotomizing continuous predictors in multiple regression: a bad idea. Stat Med 2006;25(1):127-41.
- Churchward-Venne TA, Tieland M, Verdijk LB, et al. There are no nonresponders to resistance-type exercise training in older men and women. Journal of the American Medical Directors Association 2015;16(5):400-11.
- Senn SJ. Individual response to treatment: is it a valid assumption? BMJ 2004;329(7472):966-68.


")


I thank Stephen Senn for this great guest post. It’s amazing that as much as people decry dichotomization of tests, it lives on in both the “diagnostic model” of statistical tests, and in medicine. We learn from Senn’s discussion on this (see also the two linked posts) how arbitrary the classification of “responder” is (e.g., with headaches).
The diagnostic screeners and “positive predictive value” advocates in significance testing likewise endorse the measure of how many tests you’d have to run at their favorite significance level to get one additional replication (by their measurement). But no such improvement of replication would occur.
I’ve been railing against the NNT ever since I first read Hutton’s paper discussing how it’s a flawed “clay” statistic. I also find it highly disturbing how some researchers have thrown around the statistic because they think it’s an unbiased metric that can be easily compared across the board like a standardized effect size. For example, a popular website known as thennt.com attempts to compare the NNTs of several interventions like statins, blood pressure medications, etc without providing any confidence intervals for the NNTs and without providing a comparator. Really frustrating.
Hutton, J. L. (2000). Number needed to treat: properties and problems. Journal of the Royal Statistical Society: Series A (Statistics in Society), 163(3), 381–402. https://doi.org/10.1111/1467-985X.00175
Thanks for reminding of Jane Hutton’s paper. It’s a classic I can highly recommend.
Yes, Hutton is a must-read on the topic (and did a follow-up 2009 clinical paper on NNT, British Journal of Haematology, 146, 27–30, doi:10.1111/j.1365-2141.2009.07707). Interestingly though, Altman & Deeks have a comment immediately following Hutton 2000 (as do LeSaffre & Pledger) which seems more critical of Hutton than of NNT. Hutton then responds in kind.
Sander:
Found this one – Douglas G Altman and Jonathan J Deeks BMC Medical Research Methodology 2002.
I was working with them at the time and their primary concern was to stop folks from collapsing all the studies and analyzing the data as if it was a single study.
I might have actually suggested some of this wording “Given the choice between a method that always gives a right answer and a method that sometimes or even usually gives the right answer, it is common sense to use the one that always gives the right answer.”
However, I could never convince either of them that it would ever be worthwhile going beyond their view of meta-analysis as simply a weighted average of statistics reported in studies. Binary outcomes are unusual in that group totals are sufficient under the usual assumptions and a number of effect measures are immediately available.
Now, I had spent almost a year working on various versions of “Bayesian random effects meta‐analysis of trials with binary outcomes: methods for the absolute risk difference and relative risk scales by D. E. Warn, S. G. Thompson and D. J. Spiegelhalter, Statistics in Medicine 2002.
Keith O’Rourke Douglas G. Altman” as an attempt to convince Dough otherwise.
Do not think I was successful, especially since the editor did not decide to accept it until August 2005 so it likely fell from his list of things to think about.
Now, not everyone may be aware that Doug Altman recently passed away https://en.wikipedia.org/wiki/Doug_Altman
All good points, but isn’t the basic causal misinterpretation of NNT shared by every simple comparative measure including risk ratios and differences? NNT is NOT (as some of the quoted sources claim) the number needed to treat for one patient to benefit, it is the number needed to treat for AT LEAST one to benefit. The risk difference from which it is computed only shows the average difference in response for a dichotomy; it may be that every patient benefited, but few of those passed the threshold needed for the dichotomy to change (e.g., 5-year survival). I have (often along with colleagues, especially James Robins) written many articles about the same logical problem, but in the context of harms measured by risk ratios (RR), where the attributable fraction (RR-1)/RR is widely misinterpreted as the proportion harmed by treatment (or “probability of causation”) but is in reality only a lower bound on that proportion (e.g., 1). Likewise, NNT is only an upper bound on the number needed to treat for one patient to benefit.
1. Greenland S (1999). The relation of the probability of causation to the relative risk and
the doubling dose: A methodologic error that has become a social problem. American
Journal of Public Health, 89, 1166-1169.
I agree with Sander in principle. Nevertheless, in connection with the hype for personalised medicine I do not find the other measures implicated anywhere near as frequently as the NNT. This may, of course, reflect the popularity of the NNT but I don’t think that is the whole story. In any case, as much as anything, my target is the appalling habit of labelling some patients as responders and others as non-reorders. This leads to hasty inappropriate imputation of causality.