
Lung Scans[0]
As much as doctors and hospitals are raising alarms about a shortage of ventilators for Covid-19 patients, some doctors have begun to call for entirely reassessing the standard paradigm for their use–according to a cluster of articles to appear in the last week. “What’s driving this reassessment is a baffling observation about Covid-19: Many patients have blood oxygen levels so low they should be dead. But they’re not gasping for air, their hearts aren’t racing, and their brains show no signs of blinking off from lack of oxygen.”[1] Within that group of patients, some doctors wonder if the standard use of mechanical ventilators does more harm than good.[2] The issue is controversial; I’ll just report what I find in the articles over the past week. Please share ongoing updates in the comments.
I. Gattinoni: “COVID-19 pneumonia: different respiratory treatment for different phenotypes?”
Luciano Gattinoni, one of the world’s experts in mechanical ventilation, “says more than half the patients he and his colleagues have treated in Northern Italy have had this unusual symptom. They seem to be able to breathe just fine, but their oxygen is very low”. …
He says these patients with more normal-looking lungs, but low blood oxygen, may also be especially vulnerable to ventilator-associated lung injury, where pressure from the air that’s being forced into the lungs damages the thin air sacs that exchange oxygen with the blood. [3]
Gattinoni labels these patients (more normal-looking lungs, but low blood oxygen) as Type L, and urges they be treated differently than the type of acute respiratory [ARDS] patients seen prior to Covid-19. This second type he calls Type H. (His editorial is in [4]). I found a picture of Type L and Type H lungs at this link on p. 12.
Patients with respiratory failure who can still breathe OK, but have still have very low oxygen, may improve on oxygen alone, or on oxygen delivered through a lower pressure setting on a ventilator.[3]
Gattinoni thinks the trouble for these patients may not be swelling and stiffening of their lung tissue, which is what happens when an infection causes pneumonia. Instead, he thinks the problem may lie in the intricate web of blood vessels in the lungs.[a]
Gattinoni says putting a patient like this on a ventilator under too high a pressure may cause lung damage that ultimately looks like ARDS.[3]
In other words, the high pressure of the ventilator may turn a Type L patient into a more serious Type H patient. “If you start with the wrong protocol, at the end they become similar,” Gattinoni said.[2] Oy! He recommends the two types (which can be determined in a number of ways) be treated differently: Type L patients receive greater benefit from less invasive oxygen support, via breathing masks, such as those used for patients with sleep apnea, nasal cannulas, or via a non-invasive high flow device.
Gattinoni said one center in central Europe that had begun using different treatments for different types of COVID-19 patients had not seen any deaths among those patients in its intensive care unit. He said a nearby hospital that was treating all COVID-19 patients based on the same set of instructions had a 60% death rate in its ICU. [He did not give the names of the hospitals.]
“This is a kind of disease in which you don’t have to follow the protocol — you have to follow the physiology,” Gattinoni said. “Unfortunately, many, many doctors around the world cannot think outside the protocol.” [3]
II. Kyle-Sidell: Covid vent protocols need a second look
But there are some doctors who may want to think outside the protocol, yet face pressure against doing so–according to Cameron Kyle-Sidell, an emergency room and critical care doctor at Maimonides Medical Center in Brooklyn.
The article that captured my attention on April 6 was the surprising transcript of Kyle-Sidell being video interviewed by WebMD chief medical officer John Whyte [5]:
Whyte: You’ve been talking on social media; you say you’ve seen things that you’ve never seen before. What are some of those things that you’re seeing?
Kyle-Sidell: When I initially started treating patients, I was under the impression, as most people were, that I was going to be treating acute respiratory distress syndrome (ARDS)… And as I start to treat these patients, I witnessed things that are just unusual. …In the past, we haven’t seen patients who are talking in full sentences and not complaining of overt shortness of breath, with saturations [blood oxygen levels] in the high 70s [normal is said to be between 95 and 100].[b].
This originally came to me when we had a patient who had hit what we call our trigger to put in a breathing tube, … Most of the time, when patients hit that level of hypoxia, they’re in distress and they can barely talk; they can’t say complete sentences. She could do all of those and she did not want a breathing tube. So she asked that we put it in at the last minute possible. It was this perplexing clinical condition: When was I supposed to put the breathing tube in?…
We ran into an impasse where I could not morally, in a patient-doctor relationship, continue the current protocols which, again, are the protocols of the top hospitals in the country. … So I had to step down from my position in the ICU, and now I’m back in the ER where we are setting up slightly different ventilation strategies. Fortunately, we’ve been boosted by recent work by Gattinoni.
Whyte: Do you feel that somewhere the world made a wrong turn in treating COVID-19?
Kyle-Sidell: I don’t know that they made a wrong turn. I mean, it came so fast. … It’s hard to switch tracks when the train is going a million miles an hour. …But I do think that it starts out with knowing, or at least accepting the idea, that this may be an entirely new disease. Because once you do that, then you can accept the idea that perhaps all the studies on ARDS in the 2000s and 2010s, which were large, randomized, well-performed, well-funded studies, perhaps none of those patients in those studies had COVID-19 or something resembling it. It allows you to move away from a paradigm in which this disease may fit and, unfortunately, walk somewhat into the unknown.
…One of the reasons I speak up, and I hope people at the bedside speak up, is that I think there may be a disconnect between those who are seeing these patients directly, who are sensing that something is not quite right, and those brilliant people and researchers and administrators who are writing the protocols and working on finding answers. The first thing to do is see if we can admit that this is something new. I think it all starts from there.
Gattinoni’s paper and Kyle-Sidell’s on-line discussions are having an impact in the popular press. Yesterday, the Telegraph reported that “British and American intensive care doctors at the front line of the coronavirus crisis are starting to question the aggressive use of ventilators for the treatment of patients”.[6]
In many cases, they say the machines– which are highly invasive and require the patient to be rendered unconscious– are being used too early and may cause more harm than good. Instead they are finding that less invasive forms of oxygen treatment through face masks or nasal cannulas work better for patients, even those with very low blood oxygen readings….This is the sort of treatment Boris Johnson, the Prime Minister, is said to have received in an intensive care unit at St Thomas’ Hospital in London.
…Increasingly, doctors in the UK, America and Europe are using these less invasive measures and holding back on the use of mechanical ventilation for as long as possible…Invasive ventilation is never a good option for any patient if it can be avoided. It can result in muscle wastage around the lungs and makes secondary infections more likely. It also requires a cocktail of drugs which themselves can prove toxic and lead to organ failure.[6]
“Instead of asking how do we ration a scarce resource, we should be asking how do we best treat this disease?” says physician Muriel Gillick of Harvard Medical School.[1]
III. Need Non-invasive Ventilation Risk Health Care Workers?
Yet there’s an important reason the standard protocol is to bypass non-invasive ventilation in Covid-19 patients (in the U.S.), and I don’t know if Gattinoni or Kyle-Sidell address it: they are thought to pose risks for heath care providers, at least without adequate protective devices.[c]:
One problem, though, is that CPAP [continuous positive airway pressure] and other positive-pressure machines pose a risk to health care workers…The devices push aerosolized virus particles into the air, where anyone entering the patient’s room can inhale them [spillage]. The intubation required for mechanical ventilators can also aerosolize virus particles, but the machine is a contained system after that.[1]
“If we had unlimited supply of protective equipment and if we had a better understanding of what this virus actually does in terms of aerosolizing, and if we had more negative pressure rooms, then we would be able to use more” of the noninvasive breathing support devices, said [Lakshman] Swamy [an ICU physician and pulmonologist of Boston Medical Center].[1]
But surely it would be easier to procure adequate protective equipment than obtain more ventilators, especially if it’s a way to beat the grim statistics for a significant group of Covid-19 sufferers. Italy has special plastic helmets that cordon off the patient’s head from the shoulder up, redolent of Victorian diving helmets. A virus filter prevents the aerosolization risk that is behind the common protocol. The Italian helmet, however, hasn’t been approved by the FDA, and anyway, Italy has banned its export given its own COVID-19 crisis. Fortunately, at least one group in the U. S is building its own coronavirus helmets.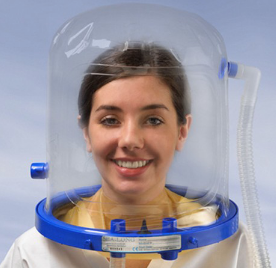
Please share your thoughts, updates, and errors.
NOTES:
[a] The following are quotes from reference [3]
Normally, when lungs become damaged, the vessels that carry blood through the lungs so it can be re-oxygenated constrict, or close down, so blood can be shunted away from the area that’s damaged to an area that’s still working properly. This protects the body from a drop in oxygen. Gattinoni thinks some COVID-19 patients can’t do this anymore. So blood is still flowing to damaged parts of the lungs. People still feel like they’re taking good breaths, but their blood oxygen is dropping all the same.[3]
One doctor treating COVID-19 patients in New York [Cameron Kyle-Sidell] says it was like altitude sickness. It was “as if tens of thousands of my fellow New Yorkers are stuck on a plane at 30,000 feet and the cabin pressure is slowly being let out. These patients are slowly being starved of oxygen”. [3]
Lung scans show the same “ground glass” appearance in both covid-19 and high altitude pulmonary edema (HAPE).
[b] An oximeter I recently bought, of not very good quality, has me at 97.
[c] Except perhaps when mechanical ventilators are in too short supply.( I am not up on the current regulations). Of course, another reason is the danger in delaying intubation that might be necessary.
REFERENCES:
[0] March 17, 2020 around 30 cases down.
[1] “With ventilators running out, doctors say the machines are overused for Covid-19” STATREPORTS, April 8, 2020
[2] “Is Protocol-Driven COVID-19 Ventilation Doing More Harm Than Good?” Medscape, April 6, 2020.
[3] “Doctors puzzle over covid-19 lung problems”, WebMD Health News, April 07, 2020
[4] Gattinoni’s editorial: “COVID-19 pneumonia: different respiratory treatment for different phenotypes?” L. Gattinoni et al., (2020)
[5] “Do COVID-19 Vent Protocols Need a Second Look?”, WebMD Interview, John Whyte, MD, MPH; Cameron Kyle-Sidell, MD, April 06, 2020
[6] “Intensive care doctors question ‘overly aggressive’ use of ventilators in coronavirus crisis”, Telegraph, April 9, 2020


")


We are seeing a normal new flu attack and a MAJOR hysteria. It takes a while to get into this guy’s thinking. He is very good. It restores some of my faith in epidemiology.
https://www.thecollegefix.com/epidemiologist-coronavirus-could-be-exterminated-if-lockdowns-were-lifted/
It is gradually coming out that well over 80% of people hardly know they’ve had the disease. The disease modelers are scrambling to revise their numbers down.
Stan: So does this suggest they are right to reassess the use of ventilators, as in the post?
Thank you for the link which is very interesting; it’s akin to the so-called Oxford model which the UK was initially following. Yes the point of the lockdown was to avoid overruning the healthcare system. We had some discussion on the overreacting/underreacting controversy that will interest you (by Steven McKinney) growing out of my post on the Diamond Princess Cruise ship.
https://errorstatistics.com/2020/03/26/the-corona-princess-learning-from-a-petri-dish-cruise/#comment-189044
It’s too bad that some of those models are having to shift so dramatically–not a good sign (for those models), but a good sign for us, but we won’t know for a while.
Where do you find evidence that 80% don’t know they have it ? Compare that to the % of asymptomatic found on the Diamond Princess.
Mayo, many thanks for your insightful and lucid writing on COVID-19.
You asked a commentator, Stan, if he had evidence in support of his statement that: “…well over 80% of people hardly know they’ve had the disease”. If you do a google search using these search terms, COVID-19 + 80% asymptomatic, you will find that the source is the World Health Organization (WHO).
https://www.who.int/docs/default-source/coronaviruse/situation-reports/20200306-sitrep-46-covid-19.pdf?sfvrsn=96b04adf_2
“For COVID-19, data to date suggest that 80% of infections are mild or asymptomatic, 15% are severe infection, requiring oxygen and 5% are critical infections, requiring ventilation. These fractions of severe and critical infection would be higher than what is observed for influenza infection.”
I trust this is helpful and look forward to following your writing on this matter in the days to come.
JP Sand:
Thanks for your comment. 80% are mild or asymptomatic doesn’t say 80% are asymptomatic. (And mild oftens means you’re not sick enough to be in a hospital.) While they don’t know the % who are asymptomatic (which is different from presymptomatic or undocumented), I’ve heard ~17%-30%. Possibly more, I don’t know.
Mayo, my point is that the WHO’s findings that “80% of infections are mild or asymptomatic” would support Stan’s comment that “80% of people hardly know they’ve had the disease”. (He did not say that 80% are asymptomatic, nor did I.)
Also, it would be challenging to make a hard and fast distinction as to where people would fall on the spectrum between asymptomatic and mild symptoms, especially when mild symptoms are non-specific as they are with COVID-19.
Oh, come on, JP Sand! (And Stan.) Not going to hospital is a long, long way short of hardly knowing that you have the disease! The use of “mild” for cases not needing hospitalisation is unfortunate, but it should not be that hard to understand if you try.
Michael: Thanks for your comment. I assumed Stan meant asymptomatic people with covid-19–since that’s an essential part of Wittkowski’s argument– and was just asking him for where he found this. I see that he phrased it more ambiguously. Of course, it’s possible that there are all these people out there who are asymptomatic, and I very much hope we will be able to uncover this eventually with tests, but among the 80% now described as mild to moderate, as you say, there are many who are quite sick.
There is a lot correct here, and @learnfromerror has done a far better job of summarizing it than I could ever explain a normal distribution. But there is a lot missing, because the commentators have not gotten to the crux, and have made slogans that are distracting.
First, and this is very very important, is that *there are NO protocols for intubation* as the NYC ER doctor suggests. I talk about that on my blog a lot. ARDS trials enroll patients who are *already intubated* and the criteria for that intubation are absent from the study protocols. It is assumed in an ARDS study that if you are intubated, you were appropriately intubated. Therefore, there is no “problem with the protocols” for ventilators, there is a glaring and longstanding problem with the criteria (or the absence of criteria) for intubating patients. Is it blood gas values, or vital signs, or physical examination signs, or subjective distress or some combination? There is ZERO standardization in this area. COVID has brought this underappreciated problem to the fore.
Why is this just coming out now? Ah, that’s another crux of the problem and a reason that COVID has become a perfect storm for ventilator management. Usually, if you intubate a little old lady with influenza, even if you do it for shaky reasons, she can be extubated (tube removed) in a couple of days or a week with little harm done (or with a level of harm that we take for granted, probably mistakenly). Not so with COVID. The natural history of the disease has 2 important features that make the decision to intubate likely to culminate in a massive therapeutic misadventure: 1.) the duration of the illness is protracted, 2, perhaps as long as 4 weeks; and 2.) the level of sedation needed to counteract the massive air hunger these patients have, for the duration they need it, is through the roof. So, 2 weeks later they are veritable zombies, cannot be weaned from sedatives (a prerequisite from being weaned from the ventilator), and are stuck on the vent, assuming that before this stage other complications have not set in and/or death ensued.
Another facet of the perfect storm, which I think is the Rosetta Stone, and a key to untangling this giant mess we find ourselves in, is that this normal lung compliance that people are talking about is *the reason why* there is this so-called “silent hypoxemia” of the type mentioned by the ER doc in the Mayo’s post. Failure to recognize this connection betrays a common misunderstanding of respiratory physiology (my disabuse of these mistakes can be found here: https://pulmccm.org/ards-review/great-lecture-applied-respiratory-physiology/). Dyspnea is not driven by hypoxemia as much as it is by hypercarbia, which can be compensated for by hyperventilation which these patients are doing! To a person who has a firm grasp on applied respiratory physiology, this is no surprise – the patients have compliant lungs, so they don’t have workload imbalance and can sustain ventilation in the face of severe hypoxemia (which is a MINOR driver of dyspnea) very well. In sum, I am not surprised by these clinical presentations, but I am surprised how woefully inadequate the community’s understanding of respiratory physiology is.
This disease is very difficult for these and many other reasons. But when the choice is let a hypoxemic person who is defending his CO2 ride it out (which she can probably do for a very long time, see my tweets about sustaining very high Ve indefinitely), versus intubated them for a marginal gain in gas exchange accompanied my a massive cost in sedation and paralysis, the choice is clear, let them ride it out.
The problem is not with the “vent protocols” the problem lies in a widespread lack of understanding of respiratory physiology which leads to frequent bad calls regarding intubation which are usually lost in the signal and noise of the fray. Not so with COVID – the bad calls begin a cascade of status iatrogenicus.
Scott: Thanks so much for your post. I will follow up on your links and tweets. The reference to a question/problem of “vent protocols” , as I understand it, is just what you mean in referring to the “glaring and longstanding problem with the criteria (or the absence of criteria) for intubating patients”. Just to avoid a problem with semantics. So you seem to be agreeing with Kyle-Sidell and Gattinoni on this. You almost make it sound as if proper knowledge of respiratory physiology, coupled with the length of time required to be intubated in the case of Covid-19, should have led to this realization all along. Is that correct? I’m a complete and total outsider here, but would like to understand the basis for a medical policy that could very well be relevant to me, and obviously to others.
Deborah, I agree with Kyle-Sidell that there is a problem with criteria for intubation, and I agree with Gattinoni that there is the observation of low compliance disproportionate to high degrees of hypoxemia and blood shunting that is probably explained by vascular phenomena.
I think also that I’m commenting after observing for many weeks (without commenting much, self-aware of my ignorance and lack of experience with #COVID) and now the natural history (the behavior of the disease over time) is more clear, including the natural history under treatment.
I could not have, weeks ago, arrived at these conclusions – they would have been postulates or tentative conclusions. However, as a starting point, I would have said, “Hey, there’s a disconnect here, let’s figure out and be judicious in our actions.” Also, my bias, if I have one, is towards “less is more” in medicine and especially critical care. I have two decades observing and over one decade documenting this perspective and its predicates on the blog and in the occasional journal article. So, I like to think that, had I been immersed earlier, I would have been quicker to apply the lessons of applied physiology.
But that doesn’t matter. What does matter is that we #learnfromerror, recognize any mistakes that we made, change course and try to correct them.
Scott: Thank you so much for writing, and thank you for your work treating Covid-19 patients now in NYC! Add any reflections as your work goes forward.
Scott, one of the sources that Deborah’s blog post cited stated the following:
Are you describing the same thing in the second to last paragraph of your comment, but in more uh operational/ medical terms?
If so, that would also explain the mystery of why these supposedly unheard of levels of blood oxygen occur with COVID-19. I found that difficult to understand. Being infected with COVID-19 should not confer an improved ability to function cognitively and physically, i.e. remaining lucid and presumably not suffering from organ failure despite 70% oxygen saturation. (Maybe because non-COVID19 ARDS patients have impaired lung elasticity/compliance, but for a still unknown reason, some COVID19 patients don’t?) That would be consistent with your later comment too. I am not certain, but I infer that the problem isn’t with ventilator protocols, or even intubation criteria. Rather, neither can be applied as rigid guidelines: respiratory function is complex. An adept pulmonologist or respiratory therapist must have good problem-solving ability/ diagnostic skills. I would guess this is only acquired through lots of clinical experience and guidance from already highly capable practitioners…?
Ellie:
I think the upshot of recent understanding of Type L and Type H covid-19 patients really does speak to an overturning of standard best procedures, whether one wants to call them “criteria” or “protocols”, and the distinction can generally be made by noting a number of differences in the two cases. That’s the good news. The bad news, as I’m reading the latest, is that we still don’t know what’s really going on or how to arrest it. They’re now becoming more concerned with kidney dialysis machines than with ventilators. I don’t know if the kidney damage is just another outgrowth of the general organ damage, or whether it’s possibly the result of antivirals or other drugs being used as treatment. It’s horrible.
Yes, I had ready about renal failure in very ill Covid-19 patients. Some of those that are on ventilators in ICU also need dialysis. One cause is a cytokine storm. The Wall Street Journal wrote a bit about it on April 10 (Haywire Immune Response Eyed in Covid deaths). A cytokine storm is an over-response by the immune system to a bacterial or viral infection. The effect on patients’ lungs was the primary concern, although kidneys were mentioned. The cytokine storm also manifests as excessive blood clotting, clogging up kidneys and clogging up dialysis machine filters too.
You’re right, it is scary, because there’s also the possibility that Covid-19 attacks kidney tissue directly.
Frequency of acute kidney injury (AKI) associated with severe Covid-19 is not well-established. This Nature comment Kidney involvement in COVID-19… (April 9) found 4.5% of patients with ARDS secondary to COVID-19 had AKI whereas 68% of those with ARDS that was not due to COVID-19 had AKI. Yet today’s news reports by CNN and The Hill quote New York City physicians who say the rate of AKI in severely ill Covid-19 patients is much higher, at 15 to 30%.
Here’s a recent talk I found on this topic:
Pingback: Covid-19 Diary : Sunday 12 April, 2020 - The Travel Insider
To all: Please take a look at the following 2017 article describing the use of HHO gas (66% Hydrogen, 33% Oxygen) to treat MERS & SARS patients.
https://symbiosisonlinepublishing.com/microbiology-infectiousdiseases/microbiology-infectiousdiseases70.php
How could we get this protocol tested in the US?
Would it even be possible to get this tested, considering the highly explosive nature of HHO?
Thanks!!
Franko
Frank: Thanks for your comment. I hope someone with the proper expertise will reply.
A small hospital in Brazil is claiming great success with something called a ‘capsule’ (with non-invasive ventilation) which looks like a plastic cone head. If it works, great. https://www.portalmarcossantos.com.br/2020/04/10/presidente-da-samel-desafia-combate-ao-covid-19-e-revela-que-hospital-esta-sem-obitos-e-com-altas-veja-video/
I hope this table formats upon posting as it appears in the comment editing space. Displaying exponential growth is tricky in so many ways.
I’ll work with Mayo to get it in properly if it does not.
I have read another really weak discussion of this pandemic by our latest Coronavirus expert, Dr. Knut Wittkowski. “Perspectives on the Pandemic II: A Conversation with Dr. Knut Wittkowski New York, April 1&2, 2020”, referenced by Stan above.
“[00:07:06.26] WITTKOWSKI: Of all symptomatic cases. 2% of all symptomatic cases will die. That is 2% of the 25,000 a day. So that is 500 people a day, and that will happen over 4 weeks. So, that could be as high as 10,000 people. Now, that compares to the normal numbers of flus during the flu season, and we have in the United States about 35,000 deaths due to flu every year during the flu season. So, it would be part of the normal situation during the flu season.”
As of April 13, 2020, 2:41 P.M. E.T. the US death toll is listed as 23,000.
We can fill out this table as our numbers come in. I fail to see how these numbers track usual seasonal flu data. I’ve put the CDCs weekly data for the 2018-2019 flu season in the left 3 columns. The season peaked around the end of February, with 14,078 cases noted. I lined up last week’s Coronavirus seekly case count with this peak number, because we’re peaking and this will all disappear in a couple of weeks. Our cases for the week leading up to April 7 were 203,576. The week before that, 118,178. The week before that, 41,781. Before that, 3,907.
Can anyone spot just how closely these numbers track? Yes, we have millions of flu cases a year, with 30,000 deaths. The mechanics of seasonal flu do not involve exponential growth in a population never exposed to the flu. Most seasons see variants of older flus resurge through the population, many of whom have had flu shots. The numbers peak in mid-winter, and tens of thousands die. It is cyclical. Many more would die without flu shots and supportive hospital care for the more severe cases.
Now we have a pandemic of a new virus. I still fail to see how the case fatality rate of the Coronavirus equates to that of seasonal flu.
Let us check back in in 4 weeks, 8 weeks, and beyond, and evaluate Dr. Knut Wittkowski’s prognostications, as the disease modelers frantically revise their numbers down. As far as I can see, Dr. Wittkowski is another prognosticator who doesn’t appreciate the characteristics of exponential growth. For the sake of the many families suffering loss, I sincerely hope that I can enjoy a piece of humble pie.
The Rockefeller University releases statement concerning Dr. Knut Wittkowski
April 13, 2020
The opinions that have been expressed by Knut Wittkowski, discouraging social distancing in order to hasten the development of herd immunity to the novel coronavirus, do not represent the views of The Rockefeller University, its leadership, or its faculty.
Wittkowski was previously employed by Rockefeller as a biostatistician. He has never held the title of professor at Rockefeller.
Small town reader is all in with Wittkowski
(New Ulm, Minesota)
https://www.nujournal.com/opinion/letters/2020/04/11/sheeple-and-shepherds/
“Knut suggests we treat COVID 19 like any other flu or epidemic we’ve ever had before. Get the kids back in school, the sooner the better. Turn the people loose. Let the kids get sick, spread the disease as fast as possible and reach herd (general population) immunity of 80%, at which time the disease will die of natural causes. ” Good luck to you, Paul Platz.
Jonathan Last, not so much:
https://thebulwark.com/newsletter-issue/knut-wittkowski-the-coronavirus-truthers-newest-expert/
The Bulwark Presents
The Triad by JVL
Knut Wittkowski: The Coronavirus Truthers’ Newest “Expert”
People are remarkably stupid.
by Jonathan V. Last
April 9, 2020 5:36 am
Steven:
Thanks so much for alerting me to this. It’s funny that it just came out today. I found the link:
https://www.rockefeller.edu/news/27872-rockefeller-university-releases-statement-concerning-dr-knut-wittkowski/
Steven:
Thanks for your comment. I will try to replace your list of numbers with your table. Good job in getting it into a post, I was about to try a screen shot.
Anyway, I will study and compare the entries in your table. The summary that I have seen at the CDC for flu cases is this:
CDC estimates that, from October 1, 2019, through April 4, 2020, there have been:
39,000,000 – 55,000,000 flu illnesses,
18,000,000 – 26,000,000 flu medical visits,
410,000 – 740,000 flu hospitalizations,
24,000 – 62,000 flu deaths
https://www.cdc.gov/flu/about/burden/preliminary-in-season-estimates.htm
Your table shows the breakdown.
But it’s not just the final numbers, even if we do wind up somewhere at the upper end of a bad or very bad flu year. It’s more, and I’ll explain what I mean in another reply later on (it’s late).
On Wittkowski, whom I’d never heard of before Stan’s link, there’s the whole herd immunity argument which I have heard before (e.g., the Oxford model) but which, to my knowledge, has not been adequately addressed. Can he be right that it would all have been over in around 2 weeks if only we’d let the children infect each other and their parents? Whatever the numbers turn out to be, he’s framed his position so that he can always say that it would have been much, much less if we had not turned to social distancing/lock-downs. He specifically says that it’s too late to recapture the the idealistic picture he paints of what would have been. There’s an intriguing mix of politics in pandemic science, I see, and I understand the allure of his perspective. Hopefully it will be possible to corroborate or falsify at some point. He makes no mention of the main reason for the lock-downs–to avoid swamping the healthcare system.
So here’s a first-pass simple view of exponential growth. Anyone can do this in a simple spreadsheet. The first column starts with 1 and doubles it in each successive row.
The next 3 columns show different death rate outcomes. Ioannidis’ 0.05% low end optimistic claim, Wittkowski’s 2%, and what looks more in line with the data I see, about 5%.
This rotten little ball of RNA has been showing an infection rate doubling time of around 3 days. We start with one case on day 0. 3 days later we have 2 cases and on we go.
I line up today’s counts from the Washington Post, 572,000 cases and 23,000 dead on April 13, since the first death announced on February 29th. Today’s cases and deaths line up at about row 21, day 57 of the simple view. If I backtrack from April 13 to Feb 29, that’s about 45 days, so I put the first death at row 6 (0.8 deaths at the 5% rate, close enough to 1 for me).
The numbers I have seen to date line up uncomfortably well with these timelines, and case and death counts at the 5% case fatality rate. Ioannidis’ and Wittkowski’s predictions of 10,000 dead seem ludicrous.
So today we are at the end of the second 4 week window. Wittkowski goes on and on about a 4 week window to get herd immunity. Exponential growth does not reach 80% of the US population (Wittkowski’s heerd immunity percentage) until the third 4 week window. How does an epidemiologist claiming his illustrious credentials not know this simplistic mathematics? 4 weeks to herd immunity is obviously ridiculous.
Now just think about this last 4 week window. At the 5% death rate, we see 13 million dead once 80% have finally ingested the virus. When is the last time the people of the USA and their leaders and their military sat by while anything killed 13 million of its citizens in a few months?
This is what Wittkowski and others would have us believe is what we need to do to ‘save the economy’.
Now keep in mind that for everyone who dies from this virus, two more people are laid out for a couple of weeks with high fever – just listen to Chris Cuomo on CNN describing his experience with this virus.
Additionally, even the 5% death rate picture so far has been in the presence of hospital care for the sicker cases. In the last few weeks of this exciting ride, hospitals are overrun as Italy experienced, and people just rest on gurneys or at home and die at a higher rate.
What does our economy look like with 20 million bodies lying about? How do businesses operate with another 40 million bed-ridden cases out of the workforce?
I see this meme more often now, this morbid idea that we should just let this disease tear through our population and get it over with.
Now there are obvious issues with this simplistic scenario. Of course when the percentage of the population infected gets higher, and people recover, there will be some naturally induced ‘distancing’ since later cases will be encountering people already exposed, not all unexposed cases. So the doubling time will slow.
So change the number of days associated with the last doubling events to 6 days, or 14 days, or a month towards the end. That last window drags out for a few more weeks. Does that look so much better?
Now much of the country still has done little to really hammer down on this infection process, so the next few weeks are not going to be pretty.
Too many people have trouble understanding exponential growth, the human mind is more inclined to think linearly. The divergence between linear effects and exponential effects are stark and shocking towards the end of an episode of exponential growth such as this.
Steven: Thank you so much for this clear explanation! It’s really interesting and important. It deserves its own blogpost for sure. It seems to be the presumed high rate of asymptomatics that is being relied on to imagine an earlier herd immunity. It’s good to have an actual, specific response, and not just name calling. I’m curious what Stan Young thinks.
Steven:
As we reach the end of April the case and case/fatality rates aren’t where your table puts them, under the various scenarios, unless I’m misreading the chart. Fortunately, the cases haven’t jumped so high. Do you have an update?
Here’s an update, one month out from April 13. At that time we were at about row 21 of this table. We hit row 22 about 2 weeks later, so our efforts at sheltering in place wherever possible slowed the doubling time from 3 days to 14 or 15 days. I’m guessing we’ll hit row 23 around the end of May, so that doubling time will be about a month, the slowest doubling time I’ve seen in countries that reacted most quickly.
If Ioannidis’s scenarios were in play, 0.1% fatality rate (column G), 100,000 deaths would occur down around row 29 of the spreadsheet, when penetrance hit around 80%. In the Ioannidis universe, we’ve hit herd immunity levels and this thing is over. I think the evidence clearly shows by now that Ioannidis’s speculations were wildly off the mark.
I’ve appended some additional doubling time date guesses, but would bet zero dollars on any of them. Doubling times will slow as disease penetrance starts limiting transmission routes for the virus, as I mentioned in an earlier post. But doubling time will accelerate in any areas where people for whatever reason can not avoid coming in close enough contact so as to be unable to break transmission routes. We’ve seen ongoing tragically rapid spread in meat processing plants whose operators refuse to implement procedures to break transmission routes. Similarly in elder care facilities and prisons. Those outbreaks now will have reverberations over the next four to six weeks as exponential doubling times of five to ten days play out in those communities. Workers in all of those facilities go home to their families and the virus spreads into the surrounding communities.
Tomas Pueyo’s posts at The Medium website give a more thorough treatment of the nuanced progression of a pandemic in its latter stages than I can summarize briefly in a basic spreadsheet and shorter blog posts. Pueyo understands exponential growth characteristics far better than most.
This virus is extremely adept at transmission, cases now even being recorded in Antarctica. As I mentioned in a previous post, doubling times will slow later in the pandemic in response to penetrance and social distancing efforts, but the numbers in this table will continue to play out. That’s just the awful truth of the chemistry and physics of adept viral particles in a mass population whose members for whatever reasons can not or will not avoid intermingling.
This is why global cooperation to allow early suppression and contact tracing is so important. SARS, MERS and Ebola outbreaks were handled adeptly in that fashion. If we want to stop such pandemics from happening repeatedly, we also have to stop concentrating wealth in extremely small pockets of society, leaving too many people hungry enough to continue going deeper into the last remaining wildlife areas for resources and food. Gordon Gekko’s declaration ‘Greed is good’, taken as a mantra from a movie into global finance, is clearly proven wrong through events such as this pandemic. The leaders of two of the largest economies, engaged in fruitless ‘trade wars’ and unable to understand and handle the truth, more concerned with self-image and excessive business profits, have yielded maximally fertile ground for pandemic viral growth. I’m guessing that an October surprise of 400,000 deaths and climbing will not bode well for one of those leaders. Coronavirus case rates in countries such as Singapore and Brazil clearly show that warm weather poses minor if any deterrent effect on the spread of this virus.
Thankfully the Centers for Disease Control (CDC) in conjunction with the National Institute of Allergy and Infectious Diseases (NIAID – Fauci’s bailiwick) and the National Heart, Lung and Blood Institute (NHLBI) are beginning large scale country-wide testing to start getting numbers on disease penetrance by assaying for COVID-19 antibodies.
https://www.washingtonpost.com/health/how-many-people-are-infected-with-the-coronavirus-a-major-study-will-attempt-to-provide-an-answer/2020/05/20/a1c867f4-9a2b-11ea-a282-386f56d579e6_story.html
I hope these efforts do not fall prey to politics. Misguided politicos in the State of Florida are already attempting to fudge numbers (“Coronavirus: Florida scientist was fired for refusing to ‘manipulate’ COVID-19 data – The Florida Times-Union), and the state of Georgia released a graph purportedly showing a decline in cases, but the graphic merely had the case counts sorted into descending order, regardless of date (“And in Georgia, data tracking Covid-19 cases has come under question after a misleading chart was posted on the Department of Public Health’s website with the dates out of order, suggesting cases were declining over time, according to an article by the Atlanta Journal-Constitution.” By Theresa Waldrop, Rosa Flores and Joe Sutton, CNN May 20, 2020).
If numbers continue to be fudged, the exponential growth rate will accelerate, and death counts in a year or two will finally reveal the true picture of what is happening now. With federal response haphazard, and state politicians and misguided judges overruling governors’ mitigation orders, the response to this pandemic lays in the hands of local leaders and all of us individually. I recommend keeping an eye on major newspapers and sensible analysts such as Tomas Pueyo for guidance as to how to stay as safe as possible in light of the suppression of facts at the CDC and various state health departments. Fortunately the provincial authorities and politicians here in the Province of British Columbia are performing with extreme competence, so I don’t have to worry as much as people in many unfortunately mis-managed areas of the USA.
Steven:
Thanks so much for the update. What do you think of the very recent CDC estimates?
https://www.cdc.gov/coronavirus/2019-ncov/hcp/planning-scenarios.html
Do they seem on the low side?
We are in deep trouble as concerns CDC data.
One thing that can not be hidden is total death counts. There are so many bureaucratic and legal requirements upon an individual’s death that demand death data to be registered, that not even Trump and his misguided crew can hide those. We will really only understand the ravages of this virus and the mismanaged handling of the pandemic by evaluating excess deaths in a year or two, no matter how hard these villains try to sweep the current data under the rug.
https://www.washingtonpost.com/health/2020/07/16/coronavirus-hospitalization-data-outcry/
Maybe Professor of Eugenics?
Thanks Steve. A very nice reality check. (Will we hear from Stan? I guess not.)
From the UpToDate.com database experts: “In patients with COVID-19 who have acute hypoxemic respiratory failure and higher oxygen needs than low flow oxygen can provide, we suggest that noninvasive modalities, may be used selectively rather than proceeding directly to intubation (eg, a younger patient without comorbidities who can tolerate nasal cannulae). On the other hand, some patients may warrant avoidance of HFNC and may benefit from proceeding directly to early intubation (eg, elderly or confused patient with comorbidities and several risk factors for progression).”
UpToDate.com offers information to nonsubcribers on covid-19. It is the preferred online reference for many US doctors.
William:
This snippet doesn’t mention possibly distinguishing patients as Type L vs Type H; perhaps they do elsewhere. It’s interesting that here it’s suggested that “elderly” patients (over 60? 70? 80?) might be put directly on ventilators, while in the UK I read somewhere yesterday they might be barred from them based on an age cut-off.
The paradigm shift discussed in this post has trickled down to the NYT: https://www.nytimes.com/2020/04/14/nyregion/new-york-coronavirus.html?referringSource=articleShare
I found this article today, but it’s dated 4/11/2020:
“Some doctors moving away from ventilators for virus patients”
https://apnews.com/8ccd325c2be9bf454c2128dcb7bd616d
I have only seen one or two articles that discuss the problem of not even knowing that having Covid-19 antibodies means you won’t get reinfected. This is Gallo today who developed an antibody test for HIV. https://www.nbcnews.com/health/health-news/immunity-covid-19-antibodies-not-certain-hiv-co-discoverer-cautions-n1183631
A bit off topic, but related:
While I stay far away from doing professional ethics, I have read/heard enough over the years in academic philosophy to know that professional ethicists can give rival arguments for nearly all of these recommendations. So I have an idea, how about before putting out one of these declarations in leading medical journals, invite three different groups of professional ethicists, with different philosophical perspectives, to publish articles critically evaluating rival sets of recommendations. Not just always the same perspectives on “benefits”, “rewards” and “instrumental values”.
On the power of data sharing and the limits of models
=========================================
This BMJ paper reviewed 27 models: https://www.bmj.com/content/369/bmj.m1464
The conclusion: “As no covid-19 clinical prediction models can currently be recommended, clinicians will have to rely on their clinical acumen and shared experiences of best practice for now.”
Another publication looking at model predictive accuracy is https://www.sydney.edu.au/data-science/
Models are used with different perspectives.
Clinicians use models differently than health ministry officials or politicians. Also, within that group, hospital administration or regional administration personnel have a different perspective than practicing physicians.
To conduct such a discussion, you first need to elaborate on your goals (g). The models and analysis (f) done on data (X) should be considered, conditioned on the goal. It should also account for your utility function (U), Information quality: InfoQ(f,X,g) = U( f(X|g) )
Data sharing is a non trivial undertaking. Integrating primary data (your data) with secondary data requires work. This global group is trying to do it and establish some standard to allow for it https://gking.harvard.edu/covid-ccc
Going back to the first point made here. The statistics ecosystem requires now some honest rethinking. If we are not able to help clinicians, something seems wrong.
Ron: Thanks for your
BMABMJ link. Do you imagine your data quality measure yielding a single quantity? Or is the idea to have a cluster of criteria to highlight, in order to arrive at a qualitative assessment, where specific weaknesses are underscored?I assume you meant BMJ. That paper actually refers to 31 models using predictive error as a utility function. The overall conclusion comes from the poor performance of the models. You of course cannot summarize a complex picture, with several dimensions, in one number. People however like to think hierarchically and, at least, start this way. “Give me one number” is not an unusual request. The point is to be able to open the appetite and follow up on this one number with a higher resolution picture. In that sense, Fisher’s 1922 JRSS(A) paper on estimation is about that. The trick is to do this in a useful way in terms of gaining knowledge. So, the answer is yes to both your questions. The first Yes is so that we can get to “the idea to have a cluster of criteria to highlight, in order to arrive at a qualitative assessment, where specific weaknesses are underscored”
Ron:
Dear Ron:
I looked quickly at the BMJ review of predictive models claiming they’re all pretty poor:
“All 31 reviewed prediction models were found to have a high risk of bias, and evidence from independent external validation of these models is currently lacking. However, the urgency of diagnostic and prognostic models to assist in quick and efficient triage of patients in the covid-19 pandemic might encourage clinicians to implement prediction models without sufficient documentation and validation. Although we cannot let perfect be the enemy of good, earlier studies have shown that models were of limited use in the context of a pandemic, and they could even cause more harm than good. Therefore, we cannot recommend any model for use in practice at this point.”
Wow! I’m surprised (and glad) they are being critiqued so quickly since all the info is so recent. (Of course we already see the general models predicting mortality are off & are being revised accordingly.)
You write:
“The statistics ecosystem requires now some honest rethinking. If we are not able to help clinicians, something seems wrong.”
Did statistics provide more useful models before AI/machine learning predictive modeling took over? My discussions are usually about statistical inference to explain and understand (and also predict, based on general theory).
Maybe not covered in statistics world, there are two rival public health strategies for dealing with the virus.
S1. Close down everything so that the virus has no new person to attack. I call that the China strategy.
S2. Protect the old and the weak and let the virus run its course. I call that the Sweden strategy.
Obviously I paint quite simply.
Expert epidemiologists that I listen to think the overall death rates will be similar, but that S2 is much better for the economy. There is a world of evidence that a bad economy is death itself.
Using antibody results, actual case numbers are better estimated. Factoring that in, this flu is much like normal flu for death rate. Obviously the biology is rather different.
Phlemfighter: I did watch it, and I get the point, but it did make me nauseated. Ugh.
Today is Jerzy Neyman’s birthday.
John Ioannidis has posted an unreviewed article to medRxiv titled “Population-level COVID-19 mortality risk for non-elderly individuals overall and for non-elderly individuals without underlying diseases in pandemic epicenters.”
Link: https://www.medrxiv.org/content/10.1101/2020.04.05.20054361v1.full.pdf
Ioannidis concocts a bizarre metric on which to place COVID-19 victims – road deaths per billion miles driven. Once again, reducing such a complex problem to this oddly selected single dimension does little to help navigate this pandemic.
Ioannidis calculates risk of death by dividing death counts by total population counts. Of course, where governments acted early and implemented lockdowns, death counts will be lower and calculating population-wide risks will yield very small numbers. How this calculation helps us here in a situation of exponential growth is beyond me. Small initial risks get bigger quickly wherever inaction allows exponential growth to continue unabated.
Ioannidis reviews an Icelandic paper and states:
“Data from Iceland suggest that almost all infections are either asymptomatic or mildly symptomatic and thus do not come to medical attention.[31] These data also suggest that the infection fatality rate may be close to that of seasonal flu (0.1%) rather than much higher earlier estimates.”
Reference [31] is an Icelandic study titled “Early Spread of SARS-Cov-2 in the Icelandic Population”.
The methods section states:
“The targeted testing started on January 31 2020, and has focused on individuals at high risk of infection because they were symptomatic (cough, fever, aches, and shortness of breath) or coming from ski areas in Austria and northern Italy, their contacts and those who contacted the healthcare system. As of March 19, the high-risk areas designation was extended to the whole world outside Iceland. As of March 22, 4,551 individuals had been tested in this targeted screening. The population screening for SARS-CoV-2 was initiated by deCODE on March 14 when 323 individuals had tested positive for SARS-CoV-2 by the targeted screening. The screening was open to everyone symptom free or with mild symptoms of common cold that is highly prevalent in Iceland at this time of the year.”
The reported Icelandic study targeted individuals in the population with mild symptoms or symptom free. Somehow from this Ioannidis concludes that almost all infections are either asymptomatic or mildly symptomatic. The Icelandic study sought to shed light on the disease prevalence in the general population, and makes no mention of Icelandic fatalities. Yet somehow Ioannidis finds that the data ‘suggest’ an infection fatality rate of 0.1%.
There is one situation yielding very useful data, the data collected in the Italian village Vo’Euganeo, population about 3000 people, all tested. 89 COVID19 positive cases, 1 death, 50-75% asymptomatic, as reported by the local authorities.
Much speculation has been offered about how many asymptomatic cases occur during this pandemic of COVID-19. This matters because the reported case count of course cannot be used as a population denominator or a count that will show when the ‘herd immunity’ population exposure count is achieved.
I have adapted my exponential growth table using the Vo’ data. If 50% of cases are asymptomatic, then the reported case count will only be half of the true exposed, infected case count. If 75% of cases are asymptomatic, then the reported case count will be a quarter of the infected case count. This has the effect of reducing the time to herd immunity by one or two doubling times, so that the final case count and death count will be in the second to last or third to last rows, indicated in the updated table. Still large numbers, considerably higher than a typical flu season’s amount, or the 10,000 claimed by some just a month ago.
Ioannidis makes no mention of his prior declaration in his latest offering, switching now to blaming co-morbidities for all the carnage, and marvelling at the low, low risk we all face, nothing more risky than a Sunday drive in the car.
Ioannidis does bump up his case fatality rate from 0.05% to 0.1%, which I modified in the updated table. By Ioannidis’s reckoning, we’ll hit herd immunity when we see 67,000 deaths (row 28 of column D). Today’s USA counts are 632,000 cases and 31,000 fatalities (CDC COVID-19 web page) so we are one doubling time away from herd immunity by his reasoning.
Now thankfully today, three days after April 13, we do not see double the case and death counts, so all of the social distancing being practiced in sensibly governed areas is slowing the rate of spread. But with several state governors still doing nothing (Arkansas, Iowa, Nebraska, North Dakota, Oklahoma, South Dakota, Utah and Wyoming), exponential growth will proceed more rapidly in some areas. The closing of meat plants in such states shows that letting the disease tear unabated through the population does not yield continuing and uninterrupted business services. If leadership is absent very early, the virus will shut down the economy. The village of Vo’ in Italy, and the South Korean response, show that swift and thorough action immediately when there are very few cases and deaths yields the best outcome for the economy.
Here’s a new article based on antibody tests in Santa Clara: “Our data imply that, by April 1 (three days prior to the end of our survey) between 48,000 and 81,000 people had been infected in Santa Clara County. The reported number of confirmed positive cases in the county on April 1 was 956, 50-85-fold lower than the number of infections predicted by this study.”
Click to access 2020.04.14.20062463v1.full.pdf
Here’s a criticism of that article on Gelman’s blog and elsewhere:
https://statmodeling.stat.columbia.edu/2020/04/19/fatal-flaws-in-stanford-study-of-coronavirus-prevalence/
I wasn’t sure if that Santa Clara study precluded subjects who either tested positive for Covid-19, or who were told, “your symptoms are entirely in keeping with covid-19 patients, but we are only allowed to test patients in hospitals, so proceed with the following at-home care”. This is the case in NYC, and those patients were often treated with medicines but at home. As I read the paper, and its indications of possible biases, it appears that such people were NOT precluded from this study. And it stands to reason that people who tested positive or who were told they almost certainly have it would been the most keen to be tested for antibodies.
It would be important to know what % of the people tested reported having symptoms (in answer to that question).
On the statistics, on a rough scan of Gelman’s blog, which included another critic, a key problem is that using the lower estimate of specificity (essentially the complement of the type i error) would produce an interval that included 0.
A concern that I would have is the “adjusted” measure of prevalence (or seropositives) from 1.5% to around 3% or more. I’m sure they didn’t predesignate the adjustment technique, although it’s partly explained in the article.
I’m sure all this will get corrected soon.
When people are found to be infected and asymptomatic, is there any follow-up to see if they are still asymptomatic next week? If not, then we need to be very cautious about taking the data at face value.
If there is a delay between infection and the appearance of symptoms then a survey will always find people who do not _yet_ have symptoms. In a situation where the number of infections is rising rapidly over time then many of the people surveyed will be freshly infected and thus likely to be, so far, asymptomatic.
Michael: yes, it’s unclear how many are merely presymptomatic. Here’s one note on this:
“The WHO sent a team to China and visited community centers, clinics and hospitals, and transportation hubs. Through their data collection, the team found that about 75% of people who were initially classified as “asymptomatic” went on to develop symptoms, she said. This matches up with the CDC’s findings at the nursing facility in Washington.”
https://www.propublica.org/article/what-we-need-to-understand-about-asymptomatic-carriers-if-were-going-to-beat-coronavirus
This paper including Ioannidis reads more sensibly than his last couple of odd publications. I look forward to a peer-reviewed version of this paper. We need more testing such as this, all over the country, on a regular basis, so we can understand where we are at. At 2.5% penetrance, there’s another 5 doubling times to herd immunity if 80% does end up yielding herd immunity for COVID-19. So Santa Clara county is nowhere near herd immunity as some have been trying to suggest.
If we really want to understand this disease, selecting a cohort of a few tens of thousands across the country, proportionately from all gender and age and socioeconomic groups, and monitoring them with testing every few days for a couple of months would give us a treasure trove of valuable data. Hopefully this study will happen somewhere and soon, I’m not certain it will happen in America with our currently hobbled CDC and NIH.
Medical experts urge caution in interpretation of preliminary unreviewed studies, including the Santa Clara study that Ioannidis participated in:
https://www.washingtonpost.com/opinions/2020/04/28/beware-studies-claiming-covid-19-death-rates-are-smaller-than-expected/
Nice peer review of problems with the Santa Clara county study.
“We have several concerns about their methodologies. First, both studies used a commercial diagnostic test known to yield false positive results (detecting the presence of antibodies to the virus where there were none). The researchers, relying on a small set of control tests mostly performed by the tests’ manufacturer, claim a false positive rate of 0.5 percent, but independent analyses of the same test have yielded much higher false positive rates that could render their conclusions invalid.
Second, in one of the studies, researchers used Facebook to recruit volunteers. This raises concerns of self-selection bias, as these individuals made the effort to leave their homes and drive to a designated location for a blood test and thus might be motivated to seek testing for various reasons, including recent symptoms or engaging in high-risk activities that boost their risk for infection. For this reason alone, one might expect a misleading higher rate of positive tests.
Third, researchers used different types of blood to establish the accuracy of the diagnostic test than used for the volunteers. They compared frozen pre-pandemic processed blood samples with the fresh blood of volunteers obtained via finger pricks. But not all blood is the same; the biochemical differences between frozen and fresh blood could interfere with the accuracy of the reading.
These findings also obscure an indisputable fact: Hospital intensive care units in hot-spot cities have been overrun with seriously ill covid-19 patients. We do not see this even in bad flu seasons. That means relaxation of social distancing before more of the population is immune measures could end up overwhelming our hospitals.
Consider New York City, where health officials say up to 21 percent of residents may have been infected. While high, this number is far above the false positive rate and is plausible because the city has been an epicenter of the pandemic, with as many as 17,000 deaths. Using expert estimates that 40 to 70 percent of Americans will be infected with the new coronavirus, a death rate of 1 percent would translate into 1.4 million to 2.3 million people succumbing to the disease — a number closely aligned with early predictions of the likely death toll in the absence of mitigation measures such as a vaccine or social distancing. And that does not account for survivors left with serious heart, lung, kidney and neurological damage.
The calculus involved in designing policies that balance lives and livelihoods is astoundingly complex. One cannot be done at the expense of the other. These choices require hard evidence tempered with humility. Scientific evidence may not be the only factor in this equation, but it’s the most critical one.
Making decisions that involve human lives should be based on science, verified and vetted. In our understandable desire to return to normalcy today, we can ill afford to sacrifice our health and well-being tomorrow.”
Steven:
It seems that it would have been very easy to ascertain which subjects either had tested positive or were told, they should assume by their symptoms that they have it, even though they don’t meet the requirements for getting tested. Perhaps they have this information but are keeping it under wraps. If they don’t have it, it was a waste of crucial info not to have obtained it.
The Fairbanks School of Public Health at Indiana University-Purdue University–Indianapolis (IUPUI) did run a State of Indiana random population survey, randomly selecting and testing many thousands of state residents so as to better assess disease penetrance, asymptomatic case rate and age-specific infection fatality rates. Why Ioannidis could not have advocated for such a study within the illustrious halls of Stanford’s Epidemiological group is beyond me.
https://fsph.iupui.edu/news-events/news/phase-3-finding-statewide-covid-19-study-indiana.html
Even with the complexities yielding some limitations on interpretation of this study, this is indeed what an actual scientific study looks like. A large, randomly chosen population subset at multiple time points to yield actually useful data for understanding the characteristics of this COVID-19 pandemic.
This group has a most useful summary of findings in the Annals of Internal Medicine (doi.org/10.7326/M20-5352), a much better venue to discuss the science of COVID-19 than Ioannidis appearing on the Fox propaganda channel’s Mark Levin “show”.
The paper by Gattinoni et al. from April 16, 2020 is out. https://ccforum.biomedcentral.com/articles/10.1186/s13054-020-02880-z
Andrew Gelman discusses the data from Sweden today on his blog:
https://statmodeling.stat.columbia.edu/2020/04/20/coronavirus-in-sweden-whats-the-story/
An updated version of the Iceland paper has been published in NEJM; it adds a random survey carried out April 1-4 with 13 of 2283 (0.38%) positive by qRT-PCR. Iceland had 1364 cases on April 4 (ECDC data, 0.57% of population).
CDC mortality surveillance shows graphically that Covid-19 is nothing like the flu; scrolling down from https://www.cdc.gov/coronavirus/2019-ncov/covid-data/covidview/index.html#hospitalizations we find a graph that has on the left the excess mortality from the severe 2017/18 flu season, and Covid-19 at the right edge in the present looking quite different.
The University of Chicago evaluated bubble helmets for treatment of ARDS back in 2016 , a paper on the clinical trial is at doi:10.1001/jama.2016.6338 , “may be a superior strategy”, and a followup in 2018 concluded “mitigates the long term complications”. https://www.ncbi.nlm.nih.gov/pmc/articles/PMC6005726/
There are now a number of studies/blogs/etc. getting after the “true” case rate. Ioannidis was more or less the first. Then the WSJ oped by Bendavid. Now three serology reports for antibodies, Massachusetts, Santa Clara, LA. All point to massive under counting of the number of cases. China published in Science that ~85% of the cases were silent in the sense that they did not get into the official number of cases.The general thrust is that the actual case fatality rate is coming down and is close to the flu CFR. The CFR varies by age and comorbidity so much that an overall CFR is close to meaningless. For every action, there is a reaction. CDC has redefined deaths. Death with is now classified as death because of the virus. As the % with antibodies increases, every death will be a flu death.
Stan:
I’m very sympathetic to the idea that we should be/have been widely testing (both for covid-19 and antibodies to it) all along. I’d had some email exchanges with Ioannidis on this, and I’m glad he’s pushed forward. However, as I’m guessing you know, there have been a number of issues with the estimates. A comment of mine above mentions these only slightly:
https://errorstatistics.com/2020/04/12/paradigm-shift-in-pandemic-vent-protocols/comment-page-1/#comment-189298
I don’t see why a random sample would be so difficult. The Stanford one is not. Sweden just had to withdraw a paper that made an estimate of invisible cases in the population. The problem was that it estimated there was a number n of cases in Sweden where n vastly exceeded the total population of Sweden.
When I write the comment, I’ll come back to put the link here.
I’m sure all those estimates will soon be improved.
Here’s a link to my comment on the current post (a guest post on randomisation by S. Senn): https://errorstatistics.com/2020/04/20/s-senn-randomisation-is-not-about-balance-nor-about-homogeneity-but-about-randomness-guest-post/comment-page-1/#comment-189308
A new article appeared: First look at the outcomes of covid-19 patients in NYC hospitals
“The eye-opening figures come when the mortality of these patients were considered (which was again, limited to the population that had died or been discharged). Those who had been put on the ventilator among this population died 88 percent of the time. For those older than 65, the mortality reached a staggering 97 percent. For those who didn’t need a ventilator, the mortality rate was 27 percent for those over 65 and 20 percent for those below.”
https://arstechnica.com/science/2020/04/first-look-at-the-outcomes-of-covid-19-patients-in-ny-hospitals/
Of course, the sickest are put on ventilators and so one can’t infer the ventilator contributed to the high death rate, but several doctors who have compared patients, at least from their own experience, claim the ventilator was harmful.