

.
Stephen Senn
Consultant Statistician
Edinburgh, Scotland
The usual warning
Although I have researched on clinical trial design for many years, prior to the COVID-19 epidemic I had had nothing to do with vaccines. The only object of these amateur musings is to amuse amateurs by raising some issues I have pondered and found interesting.
Coverage matters
In this blog I am going to cover the statistical analysis used by Pfizer/BioNTech (hereafter referred to as P&B) in their big phase III trial of a vaccine for COVID-19. I considered this in some previous posts, in particular Heard Immunity, and Infectious Enthusiasm. The first of these posts compared the P&N trial to two others, a trial run by Moderna and another by Astra Zeneca and Oxford University (hereafter referred to as AZ&Ox) and the second discussed the results that P&N reported.
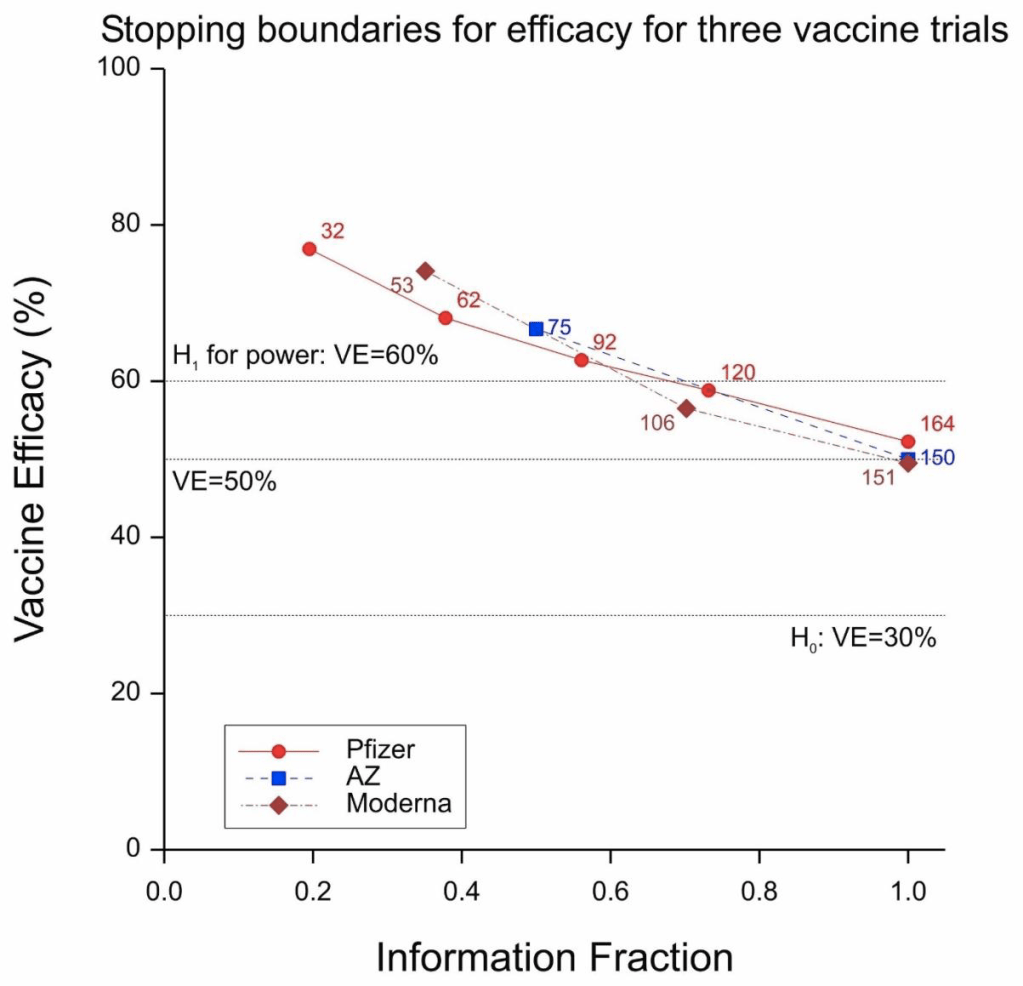
Figure 1 Stopping boundaries for three trials. Labels are anticipated numbers of cases at the looks.
All three trials were sequential in nature and, as is only proper, all three protocols gave details of the proposed stopping boundaries. These are given in Figure 1. AZ&Ox proposed to have two looks, Moderna to have three and P&B to have five. As things turned out, there was only one interim look at the P&B trial and so two, and not five, in total.
Moderna and AZ&Ox specified a frequentist approach in their protocols and P&B a Bayesian one. It is aspects of this Bayesian approach that I propose to consider.
Some symbol stuff
It is common to measure vaccine efficacy in terms of a relative risk reduction expressed as a percentage. The percentage is a nuisance and instead I shall express it as a simple ratio. If ψ, πc, πv are the true vaccine efficacy and the probabilities of being infected in the control and vaccine groups respectively, then 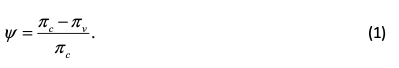
Note that if we have Yc, Yv cases in the control and vaccine arms respectively and nc, nv subjects then an intuitively reasonable estimate of ψ is
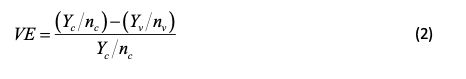
where VE is the observed vaccine efficacy.
If the total number of subjects is N and we have nc = rN, nv = (1 − r)N, with r being the proportion of subjects on the control arm, then we have
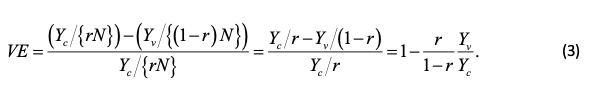

Note that if r = 1 − r = 1/2, that is to say that there are equal numbers of subjects on both arms, then (3) simply reduces to one minus the ratio of observed cases. VE thus has the curious property that its maximum value is 1 (when there are no cases in the vaccine group) but its minimum value is −∞ (when there are no cases in the control group and at least one in the vaccine group).
A contour plot of vaccine efficacy as a function of the control and vaccine group probabilities of infection is given in Figure 2.
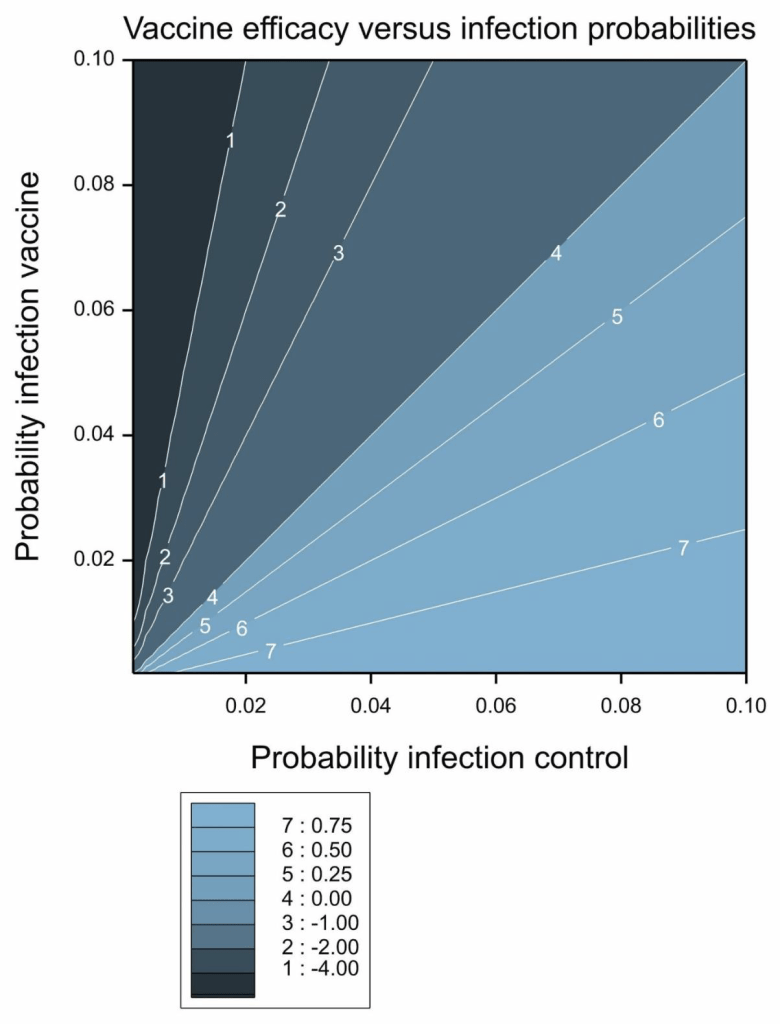
Figure 2 Vaccine efficacy as a function of the probability of infection in the control and vaccine groups.
Scaly beta
P&B specified a prior distribution for their analysis but very sensibly shied away from attempting to do one for vaccine efficacy directly. Instead, they considered a transformation, or re-scaling, of the parameter defining
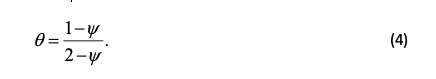
This looks rather strange but in fact it can be re-expressed as
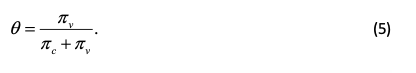
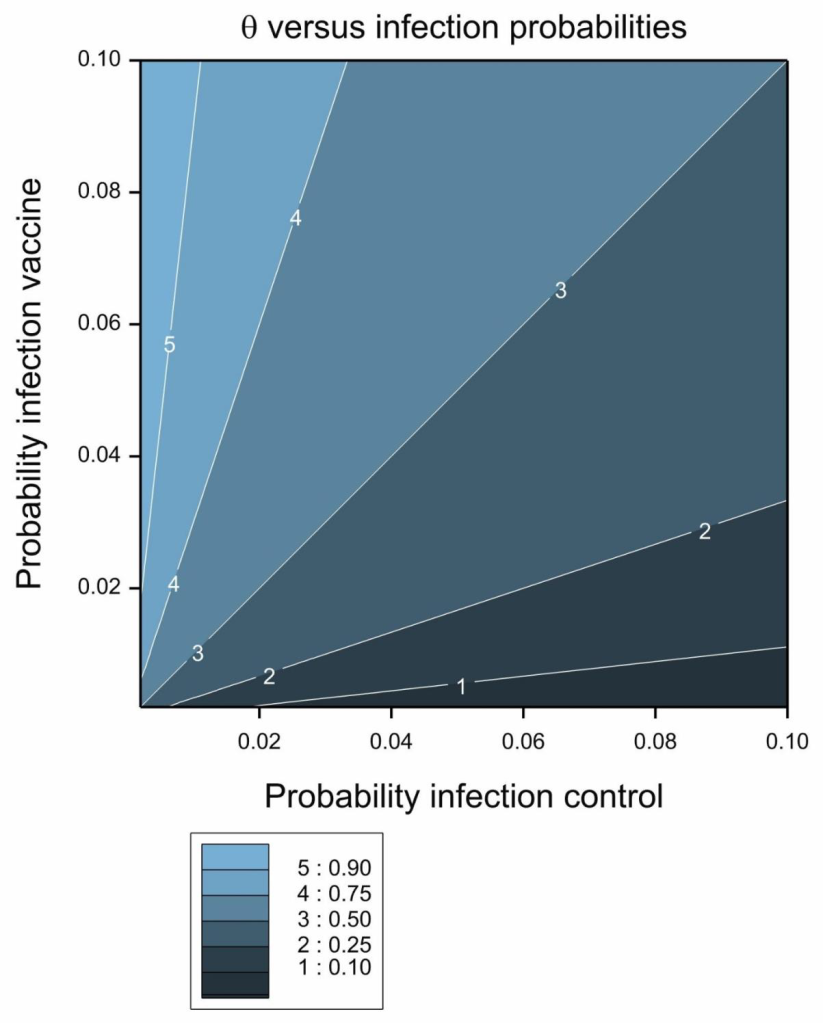
Figure 3 Contour plot of transformed vaccine efficacy, θ.
Its contour plot is given in Figure 3. The transformation is the ratio of the probability of infection in the vaccine group to the sum of the probabilities in the two groups. It thus takes on a value between 0 and 1 and this in turn implies that it behaves like a probability. In fact if we have equal numbers of subjects on both arms and condition on the total numbers of cases we can regard it as being the probability that a randomly chosen case will be in the vaccine group and therefore as an estimate of the efficacy of the vaccine. The lower this probability, the more effective the vaccine.
In fact, this simple analysis, captures much of what the data have to tell and in estimating vaccine efficacy in previous posts. I simply used this ratio as a probability and estimated ‘exact’ confidence intervals using the binomial distribution. Having calculated the intervals on this scale, I back-transformed them to the vaccine efficacy scale
A prior distribution that is commonly used for modelling data using the binomial distribution is the beta-distribution (see pp. 55-61 of Forbes et al[1], 2011), hence the title of this post. This is a two parameter distribution with parameters (say) ν, ω and mean
![]()

and variance
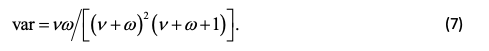

Thus, the relative value of the two parameters governs the mean and, the larger the parameter values, the smaller the variance. A special case of the beta distribution is the uniform distribution, which can be obtained by setting both parameter values to 1. The resulting mean is 1/2 and the variance is 1/12. Parameter values of ½ and ½ give a distribution with the same mean but a larger variance of 1/8. For comparison, the mean and variance of a binomial proportion are p, p(1 − p)/n and if you set p = 1/2, n = 2 you get the same mean and variance. This gives a feel for how much information is contained in a prior distribution.
Of Ps and Qs
P&B chose a beta distribution for θ with ν = 0.700102, ω = 1. The prior distribution is plotted in Figure 4. This has a mean of 0.4118 and a variance of approximately 1/11. I now propose to discuss and speculate how these values were arrived at. I come to a rather cynical conclusion and before I give you my reasoning, I want to make two points quite clear:
a) My cynicism does not detract from my admiration for what P&B have done. I think the achievement is magnificent, not only in terms of the basic science but also in terms of trial design, management and delivery.
b) I am not criticising the choice of a Bayesian analysis. In fact, I found that rather interesting.
However, I think it is appropriate to establish what exactly is incorporated in any prior distribution and that is what I propose to do.
First note the extraordinary number of significant figures (6) for the first parameter, of the beta distribution, which has a value of 0.700102 . The distribution itself (as established by its variance) is not very informative but at first sight there would seem to be a great deal of information about the prior distribution itself. This is a feature of some analyses that I have drawn attention to before. See Dawid’s Selection Paradox.
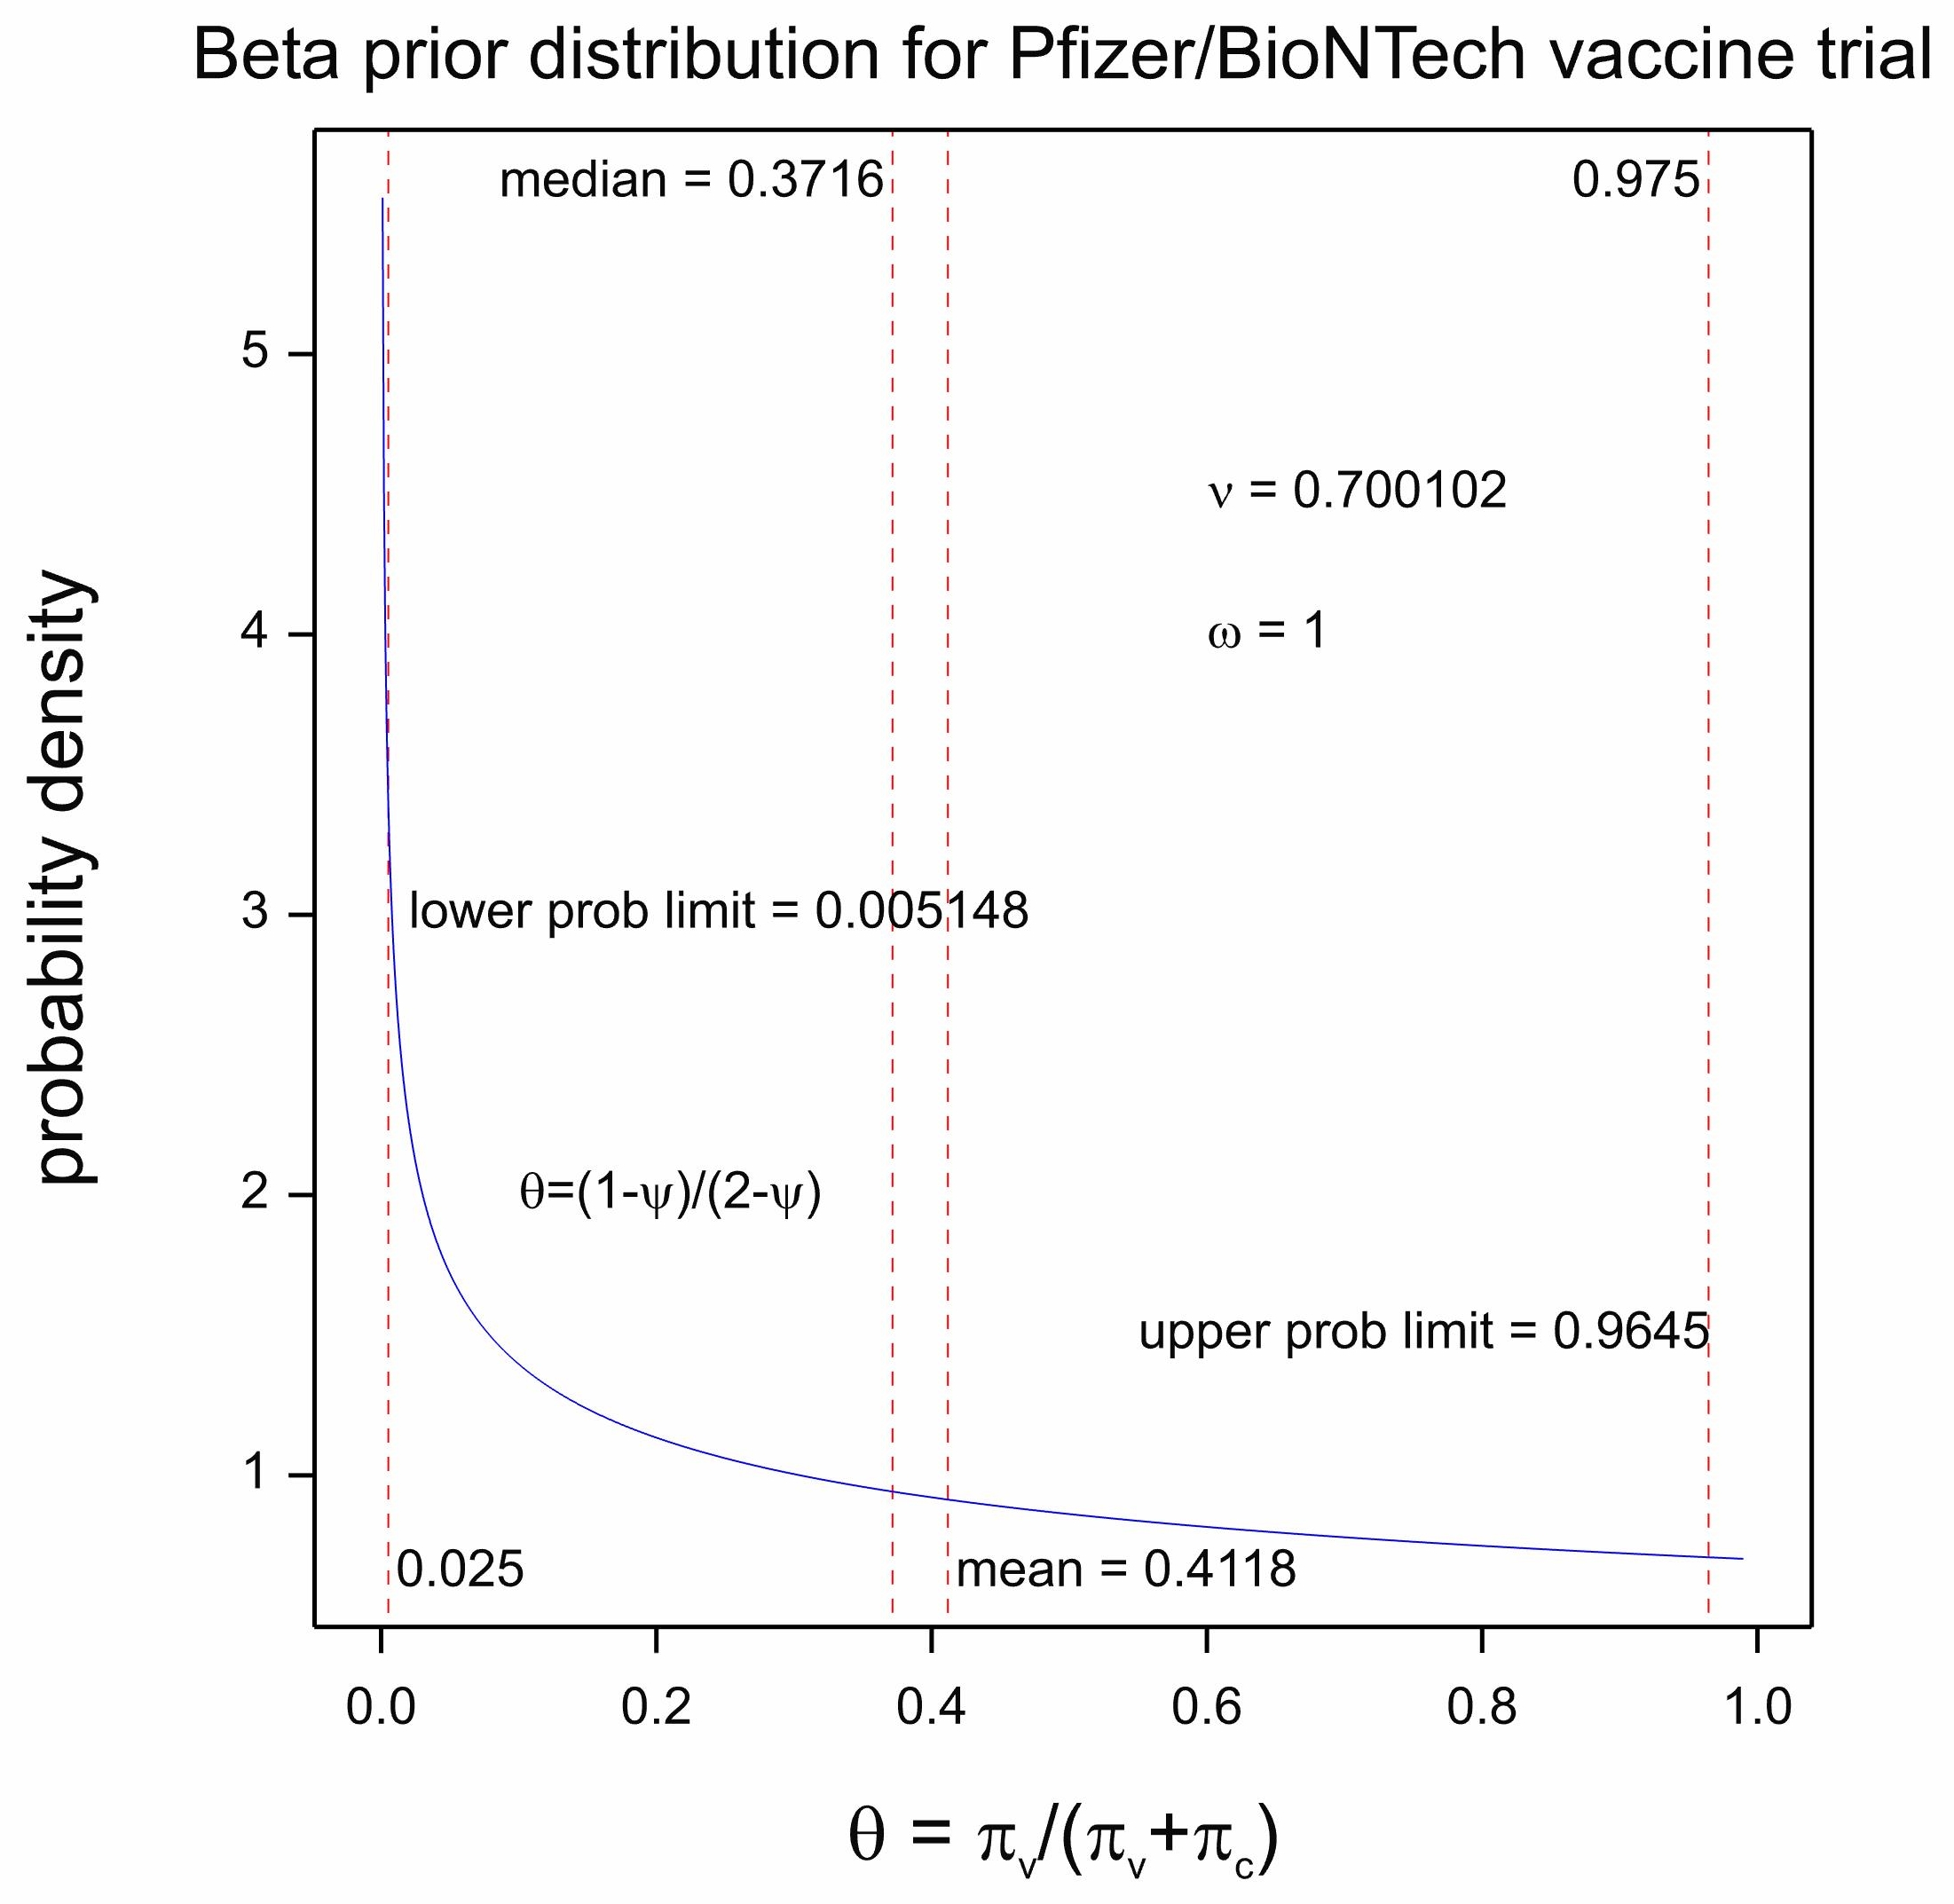
Figure 4 Prior distribution for θ
So this is what I think happened. P&B reached for a common default uniform distribution, a beta with parameters 1,1. However, this would yield an expected value of θ = 0 . On the other hand, they wished to show that the vaccine efficacy ψ was greater than 0.3. They thus asked the question, what value of θ corresponds to a value of ψ = 0.3? Substituting in (4) the answer is 0.4117647 or 0.4118 to four decimal places. They explained this in the protocol as follows: ‘The prior is centered at θ = 0.4118 (VE = 30%) which may be considered pessimistic’.
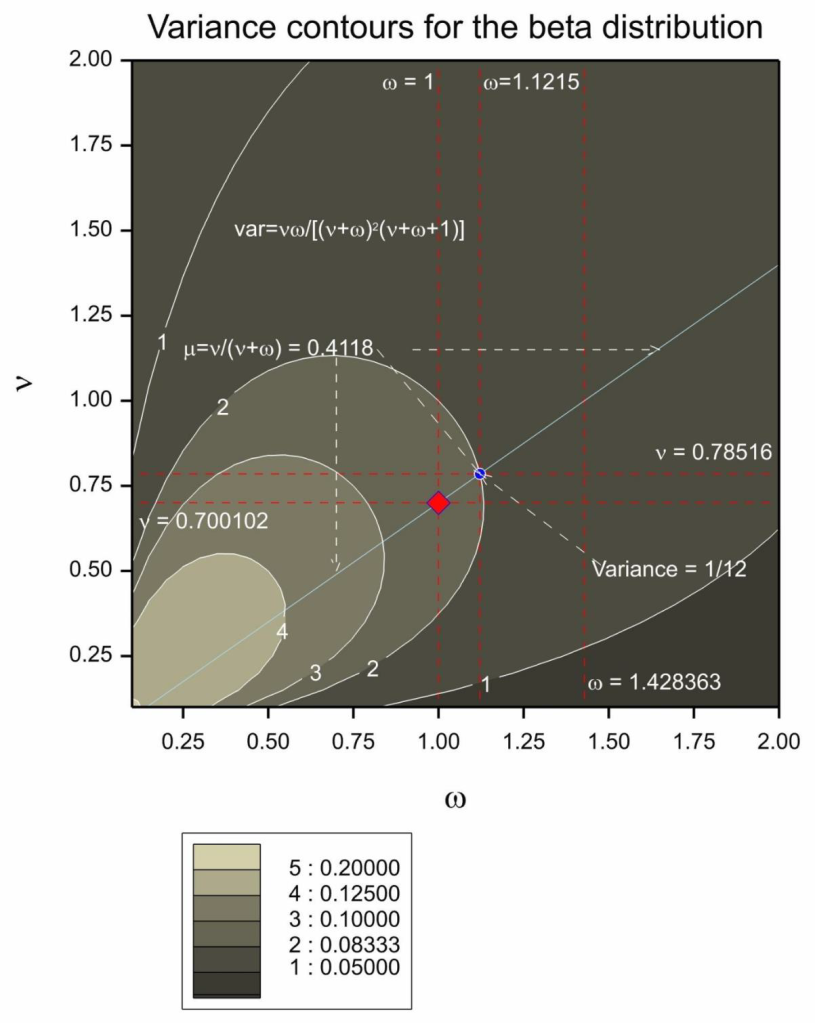
Figure 5 Combination of parameters for the prior distribution yielding the required mean. The diagonal light blue line gives the combination of values that will produce the desired mean. The red diamond gives the parameter combination chosen by P&B. The blue circle gives the parameter combination that would also have produced the mean chosen but also the same variance as a beta(1,1). The contour lines show the variance of the distribution as a function of the two parameters.
Note that the choice of word centered is odd. The mean of the distribution is 0.4118 but the distribution is not really centered there. Be that as it may, they now had an infinite possible combination of values for ν, ω that would yield an expected value of 0.4118. Note that solving (6) for ν, ω yields
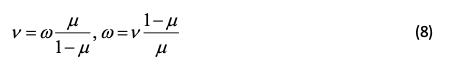

and plugging in μ = 0.4118, ω = 1 gives ν = 0.700102. Possible choices of parameter combinations yielding the same mean are given in Figure 5. An alternative to the beta(0.700102,1) they chose might have been beta(0.78516,1.1215). This would have yielded the same mean but given the equivalent variance to a conventional beta(1,1).
It is also somewhat debatable as to whether pessimistic is the right word. The distribution is certainly very uninformative. Note also that just because if the mean value on the scale is transformed to the vaccine efficacy scale it gives a value of 0.30. It does not follow that this is the mean value of the vaccine efficacy. Only medians can be guaranteed to be invariant under transformation. The median of the distribution of θ is 0.3716 and this corresponds to a median vaccine efficacy of 0.4088.
Can you beta Bayesian?
Perhaps unfairly, I could ask, ‘what has the Bayesian element added to the analysis?’ A Bayesian might reply, ‘what advantage does subtracting the Bayesian element bring to the analysis?’ Nevertheless, the choice of prior distribution here points a problem. It clearly does not reflect what anybody believed about the vaccine efficacy before the trial began. Of course, establishing reasonable prior parameters for any statistical analysis is extremely difficult[2].
On the other hand, if a purely conventional prior is required why not choose beta(1,1) or beta(1/2,1/2), say? I think the 0.3 hypothesised value for vaccine efficacy is a red herring here. What should be of interest to a Bayesian is the posterior probability that the vaccine efficacy is greater than 30%. This does not require that the prior distribution is ‘centred’ on this value.
Of course the point is that provided that the variance of the prior distribution is large enough, the posterior inference is scarcely affected. In any case a Bayesian might reply, ‘if you don’t like the prior distribution choose your own’. To which a diehard frequentist might reply, ‘it is a bit late for choosing prior distributions’.
I take two lessons from this, however. First, where Bayesian analyses are being used we should all try to understand what the prior distribution implies: in what we now ‘believe’ and how data would update such belief[3]. Second, disappointing as this may be to inferential enthusiasts, this sort of thing is not where the action is. The trial was well conceived, designed and conducted and the product was effective. My congratulations to all the scientists involved, including, but not limited to, the statisticians.
References
- Forbes, C., et al., Statistical distributions. 2011: John Wiley & Sons.
- Senn, S.J., Trying to be precise about vagueness. Statistics in Medicine, 2007. 26: p. 1417-1430.
- Senn, S.J., You may believe you are a Bayesian but you are probably wrong. Rationality, Markets and Morals, 2011. 2: p. 48-66.


")


Dear Stephen:
I’m incredibly grateful to you for elucidating, in your typically clear and insightful fashion, what the statistical analysis surrounding the Pfizer vaccine trials is all about. We’re hearing about the wonderful results, and have seen some of the numbers, but we’re largely in the dark as to where they come from. So it’s wonderful to have this! But I don’t see why the precise calculations and assumptions aren’t widely provided.You shouldn’t have to resurrect them.
I am going to have to read this much more carefully in the coming days—I hope, in the mean time, to get comments from others–, but here are some first impressions: I had expected that the introduction of a Bayesian prior here had some very good justification. For one thing, I seem to recall that one of their reports is of a confidence interval and only one of a credible interval. So my impression of the results when they first came out a long time ago (and here we are still waiting, waiting for the vaccine), was that they would have given confidence intervals for both analyses, but some parameter estimate was missing in the one case, so they invoked a “noninformative” prior of some sort. (I may be misremembering and haven’t gone back to check.)
You write: “I now propose to discuss and speculate how these values were arrived at. I come to a rather cynical conclusion…. Perhaps unfairly, I could ask, ‘what has the Bayesian element added to the analysis?’ A Bayesian might reply, ‘what advantage does subtracting the Bayesian element bring to the analysis?’ ”
Fisher might reply to that question that if the prior doesn’t make much difference to the analysis, “we may well ask what the expression is doing in our reasoning at all, and whether, if it were altogether omitted, we could not without its aid draw whatever inferences may, with validity, be inferred from the data” (Fisher 1934b, p. 287; “Two New Properties of Mathematical Likelihood”)
Near the end you say “Nevertheless, the choice of prior distribution here points a problem. It clearly does not reflect what anybody believed about the vaccine efficacy before the trial began.”
Why? Is that because it used the data to arrive at the prior? I take it that is typical. Weren’t they trying to match the prior hunch about the minimal effectiveness? On the one hand, you conclude: “where Bayesian analyses are being used we should all try to understand what the prior distribution implies: in what we now ‘believe’ and how data would update such belief” even though, you add, “disappointing as this may be to inferential enthusiasts, this sort of thing is not where the action is.” Where is the action? If it’s elsewhere, then we’re back to Fisher’s question as to what the prior is doing there.
How would the result be different than, say, the frequentist (error statistical) analysis using the null hypothesis (theta < .3) you discussed regarding the Oxford AZ trial? Or forming a CI. In the current post you say You “estimated ‘exact’ confidence intervals using the binomial distribution” and without a prior.
Thank you so much for this great discussion which will be of major help to us in our lives as well as in our phil stat understanding.
I’m not versed in Bayesian sequential trials, but just looking at things like “Table 5. Interim Analysis Plan and Boundaries for Efficacy and Futility” from their protocol makes me think that their approach might be in violation of the SLP. Or am I missing something important?
Thanks, Deborah. In my opinion the prior distribution was not based on any data. It was, however, a genuine prior in the sense that it was pre-specified in the protcol in advance of seeing the data. As I explain in the post, the prior distribution was chosen to have a mean equal to that which would correspond to 30% vaccine efficacy. This is the boundary value they and others (AZ/Oxford and Moderna) chose as being of interest. Again, in my opinion, a fully Bayesian approach would not therefore have chosen 30% to be the prior mean. Instead this boundary value might have been handled using a loss funtion.
I don’t want to make too much of this. My point is really that what matters here is good design, good running of the trial (a feature that statisticians often overlook) and good analysis and that as regards the latter, the choice of a Bayesian or frequentist framework is often less important than other matters.
I hope that we attract some fully paid up card carrying Bayesians to say more.
Could you analyze the difference between the positive effects of placebo (21,278 disease-free from 21,566 observed) against the positive effects of vaccine (21,712 disease-free from 21,720 observed) ? This speaks about the pertinence of vaccinal health politics for the society.
hgeorg,
to me you are forgetting (at least) two important points:
1) the time factor. These numbers are related to a period of observations of approx. 1.5 months. Spare cases will be higher over a larger period
2) The size of the population affected by the disease which is >> than 20.000
“will be” is not a valid assertion in evaluating experimental data.
This is not a post-marketing study. Evaluation studies to demonstrate a drug is worth being used have not to be made on a whole population, but on samples of population! Otherwise you never end .
What about the data collected after the report on which emergency approval was based? Does the same efficacy hold up?
A critical op-ed in BMJ by P. Doshi
https://web.archive.org/web/20210116125757/https://blogs.bmj.com/bmj/2021/01/04/peter-doshi-pfizer-and-modernas-95-effective-vaccines-we-need-more-details-and-the-raw-data/
The data presented by Pfizer should include the huge imbalance in the origin of data. Data from six countries were included, but the dominance of USA data is HUGE. It would be a great difference if 8 cases among vaccinated subjects were,e.g., from Turkey; or if 150 of the 164 cases among placebos were from, e.g., Argentina. Pfizer study should be considered a nested trial design with sub-sampling and results should have been reported differently.
I don’t agree about the Pfizer trial being unbalanced because the US is preponderent. I don’t think this matters at all and would be unconcerned if 100% of the patients were from the US. Peter Doshi, however, draws attention to missing subjects ledding to some possible imbalance and that is (potentially) more worrying.
Stephen: Can you say more about these potentially “missing” subjects? Ones they didn’t tell us about? And isn’t there more data since this initial round?
I’ve looked into this, and I say something about it in a new comment.
If no clustering of “cases” existed, I would agree with you. But we aren’t told whether it exists or not. So
I wonder why.
I suggest “https://thestatsgeek.com/2014/06/01/clustering-in-randomized-controlled-trials/” to judge the importance of clustering in randomized multi-center studies.
To what extent clustering matters depends on design. If subjects were randomised within clusters the main effect of cluster to cluster variation is eliminated. If whole clusters of sibjects were randomised to either vaccine or control then cluster variation is important. Here, the former was the case. See https://errorstatistics.com/2019/03/09/s-senn-to-infinity-and-beyond-how-big-are-your-data-really-guest-post/ for a discussion.
Among the criticisms raised regarding the Pfizer trials by Peter Doshi, associate editor at the BMJ,
https://web.archive.org/web/20210116125757/https://blogs.bmj.com/bmj/2021/01/04/peter-doshi-pfizer-and-modernas-95-effective-vaccines-we-need-more-details-and-the-raw-data/
is that the efficacy estimates exclude cases of “suspected covid-19”. He writes:
‘All attention has focused on the dramatic efficacy results: Pfizer reported 170 PCR confirmed covid-19 cases, split 8 to 162 between vaccine and placebo groups. But these numbers were dwarfed by a category of disease called “suspected covid-19”—those with symptomatic covid-19 that were not PCR confirmed. According to FDA’s report on Pfizer’s vaccine, there were “3410 total cases of suspected, but unconfirmed covid-19 in the overall study population, 1594 occurred in the vaccine group vs. 1816 in the placebo group.”’
Hilda Bastian responds to him
http://hildabastian.net/index.php/covid-19/103-unpacking-doshi-take
She seems to be discrediting his claim that many of these are false negatives,but we do know something about that rate. Besides, she notes, they do a more thorough check of suspected Covid than merely a single test, they consider, for example, separate antibody tests (but I thought that vaccinated people would show antibodies, maybe not that quickly.) In general, I’m more confused looking at his op-ed, even with her analysis. And I don’t know why they didn’t check for numbers of asymptomatic cases, especially given that it’s thought that around 40% of cases are asymptomatic.
As for the 371 discounted participants, there’s no way for an outsider to judge, but it would be informative to know how many had Covid-19.
I don’t understand why all of the raw data would not have been released. Bastian says a good deal of it has been, and has been thoroughly scrutinized by scientists. Maybe so, but the number of cases has always seemed suspiciously low.
I am not sure that the cases are suspiciously low. They targetted 164 cases https://phastar.com/blog/246-heard-immunity and they got 170 https://www.linkedin.com/pulse/infectious-enthusiasm-stephen-senn/
I was reasonably reassured by Hilda Bastian’s blog. I shall think about this some more.