

Senn
Stephen Senn
Head, Methodology and Statistics Group,
Competence Center for Methodology and Statistics (CCMS),
Luxembourg
Delta Force
To what extent is clinical relevance relevant?
Inspiration
This note has been inspired by a Twitter exchange with respected scientist and famous blogger David Colquhoun. He queried whether a treatment that had 2/3 of an effect that would be described as clinically relevant could be useful. I was surprised at the question, since I would regard it as being pretty obvious that it could but, on reflection, I realise that things that may seem obvious to some who have worked in drug development may not be obvious to others, and if they are not obvious to others are either in need of a defence or wrong. I don’t think I am wrong and this note is to explain my thinking on the subject.
Conventional power or sample size calculations
As is happens, I don’t particularly like conventional power calculations but I think they are, nonetheless, a good place to start. To carry out such a calculation a statistician needs the following ingredients
- A definition of a rational design (the smallest design that is feasible but would retain the essential characteristics of the design chosen).
- An agreed outcome measure.
- A proposed analysis.
- A measure of variability for the rational design. (This might, for example, be the between-patient variance σ2 for a parallel group design.)
- An agreed type I error rate, α.
- An agreed power, 1-β.
- A clinically relevant difference, δ. (To be discussed.)
- The size of the experiment, n, (in terms of multiples of the rational design).
In treatments of this subject points 1-3 are frequently glossed over as already being known and given, although in my experience, any serious work on trial design involves the statistician in a lot of work investigating and discussing these issues. In consequence, in conventional discussions, attention is placed on points 4-8. Typically, it is assumed that 4-7 are given and 8, the size of the experiment, is calculated as a consequence. More rarely, 4, 5, 7 and 8 are given and 6, the power, is calculated from the other 4. An obvious weakness of this system is that there is no formal mention of cost whether in money, lost opportunities or patient time and suffering.
An example
A parallel group trial is planned in asthma with 3 months follow up. The agreed outcome measure is forced expiratory volume in one second (FEV1) at the end of the trial. The between-patient standard deviation is 450ml and the clinically relevant difference is 200ml. A type I error rate of 5% is chosen and the test will be two-sided. A power of 80% is targeted.
An approximate formula that may be used is
![]()
Here the second term on the right hand side reflects what I call decision precision, with zα/2, zβ as the relevant percentage points of the standard Normal. If you lower the type I error rate or increase the power, decision precision will increase. The first term on the right hand side is the variance for a rational design (consisting of one patient on each arm) expressed as a ratio to the square of a clinically relevant difference. It is a noise-to-signal ratio.
Substituting we have
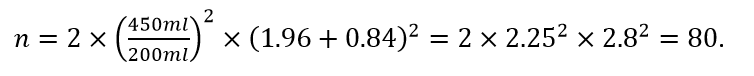
Thus we need an 80-fold replication of the rational design, which is to say, 80 patients on each arm.
What is delta?
I now list different points of view regarding this.
1. It is the difference we would like to observe
This point of view is occasionally propounded but it is incompatible with the formula used. To see this consider a re-arrangement of equation (1) as
![]()
The numerator on the left hand side is the clinically relevant difference and the denominator is the standard error. Now if the observed difference, d, is the same as the clinically relevant difference the we can replace δ by d in (2) but that would imply that the ratio of observed value to statistic would be (in our example) 2.8. This does not correspond to a P-value of 0.05, which our calculation was supposed to deliver us with 80% probability if the clinically relevant difference obtained but to a P-value of 0.006, or just over 1/10 of what our power calculation would accept as constituting proof of efficacy.
To put it another way if δ is the value we would like to observe and if the treatment does, indeed, have a value of δ then we have only half a chance, not an 80% chance, that the trial will deliver to us a value as big as this.
2. It is the difference we would like to ‘prove’ obtains
This view is hopeless. It requires that the lower confidence interval should be greater than δ. If this is what is needed, the power calculation is completely irrelevant.
3. It is the difference we believe obtains
This is another wrong-headed notion. Since, the smaller the value of δ the larger the sample size, it would have the curious side effect that given a number of drug-development candidates we would spend most money on those we considered least promising. There are some semi-Bayesian versions of this in which a probability distribution for δ would be substituted for a single value. Most medical statisticians would reject this as being a pointless elaboration of a point of view that is wrong in the first place. If you reject the notion that δ is your best guess as to what the treatment effect is there is no need to elaborate this rejected position by giving δ a probability distribution.
Note, I am not rejecting the idea of Bayesian sample size calculations. A fully decision-analytic approach might be interesting. I am rejecting what is a Bayesian-frequentist chimera.
4. It is the difference you would not like to miss
This is the interpretation I favour. The idea is that we control two (conditional) errors in the process. The first is α, the probability of claiming that a treatment is effective when it is, in fact, no better than placebo. The second is the error of failing to develop a (very) interesting treatment further. If a trial in drug development is not ‘successful’, there is a chance that the whole development programme will be cancelled. It is the conditional probability of cancelling an interesting project that we seek to control.
Note that the FDA will usually requires that two phase III trials are ‘significant’ and significance requires that the observed effect is at least equal to  In our example this would give us 1.96/2.8=0.7δ, or a little over two thirds of δ for at least two trials for any drug that obtained registration. In practice, the observed average of the two would have an effect somewhat in excess of 0.7δ. Of course, we would be naïve to believe that all drugs that get accepted have this effect (regression to the mean is ever- present) but nevertheless it provides some reassurance.
Lessons
In other words, if you are going to do a power calculation and you are going to target some sort of value like 80% power, you need to set δ at a value that is higher than that you would be happy to find. Statisticians like me think of δ as the difference we would not like to miss and we call this the clinically relevant difference.
Does this mean that an effect that is 2/3 of the clinically relevant difference is worth having? Not necessarily. That depends on what your understanding of the phrase is. It should be noted, however, that when it is crucial to establish that no important difference between treatments exists, as in a non-inferiority study, then another sort of difference is commonly used. This is referred to as the clinically irrelevant difference. Such differences are quite commonly no more than 1/3 of the sort of difference a drug will have shown historically to placebo and hence much smaller than the difference you would not like to miss.
Another lesson, however, is this. In this area, as in others in the analysis of clinical data, dichotomisation is a bad habit. There are no hard and fast boundaries. Relevance is a matter of degree not kind.


")


Stephen: Thanks so much for the post. This is an extremely important question that is typically overlooked, and I hope we can get clear on it with this discussion. One thing: to avoid equivocations that run wild in the “effect size” literature, I always try to use “difference” (disagreement, misfit) to allude to observed differences, and “discrepancy” to refer to underlying parametric discrepancies. I wonder if, as a first pass, it would be good to see which of your “differences” mean “discrepancies”.
Thanks, Deborah. I have to say for a start that I am not too keen on the title you have given my blog post. I think this already invites a particular way of looking at the clinically relevant difference with which many statisticians might disagree. This is because the clinically relevant difference, delta, is meant to be established independently of the power. The trial that you then design will usually have reasonable power, that’s the idea, but it is at least conceivable that you went ahead and ran a trial that only had low power. If that were the case then, to satisfy your title, you would now have to go ahead and calculate a new delta . Thus delta would become the function of power and sample size. It is true that in my numerical discussions I used some standard values of alpha and beta but the general convention is sigma, delta and alpha are given and then either beta or n follow.
Calculating delta from the power is a rather cynical procedure and not one I discussed. I am not saying it never happens. In fact in Statistical Issues in Drug Development I pointed out that it does sometimes happen and even gave a possible justification. Nevertheless, what I had in mind in the post was a value that clinicians and statisticians working in a general field would agree was a clinically relevant difference even if some trials that were run had low power to detect it.
In fact I do sometimes say that “many trials are planned using a cynically relevant difference” but I had a clinically relevant in mind.
Stephen: I cannot study this now, traveling. I don’t remember exactly what the title was to inform the reader so they can see what was wrong with it–Elbians might. I thought we discussed once, long ago, the matter of my using blog titles that described some aspect of the post I wanted to bring to people’s attention–possibly distinct from the author’s title– and we had been discussing power. My aim is always pedagogical, and galvanizing appropriate (ie.., relevant) interest. What’s “delta force”? I was afraid that “Delta force” might sound like some kind of Star Wars discussion, and even “clinical relevance” does not describe what the post is about. Does it? I had no clue, and still don’t, as to how my title “invited a particular way” of looking at things, but I am prepared to assume you are entirely right about this, and return to think about it when I’m back at home base tomorrow.
Thanks, Deborah. The title is changed back to my original (many thanks) but then my comment above will bafle some!
However, to answer your original question, delta is a peculiar parameter. It is a planning parameter and not an inferential parameter. The best way to think of it I think is to regard it as part of general screening programme that is set up without any specific reference to any particular drug that is being examined. It carries with it no particular implication of belief about the effect of the particular parameter being examined. This may or may not be a good thing but since it is St Patrick’s day I hope I will be forgiven for telling the story of the Englishman who asked the Irishman to a particular village and received the reply ‘If I was going there I wouldn’t start from here.’
If I was going to be Bayesian I would rather be hanged for a sheep than a lamb. The clinical relevance is not what I believe about the drug but what I believe about the disease. If I was going to be Bayesian the clinically relevant difference would become part of my definition of the utility and NOT of the prior belief of the effect of the drug.
To return to the frequentist framework it is most certainly not observed difference but it is not really what you call discrepancy either.
Stephen: where did I say anything about beliefs? I recall that even in my original (now rejected) title I left out #3 on beliefs. I only had room for 3 of the 4, and I naturally left out the belief one, even though it might well be plausible here.
Sorry. I did not mean to imply that YOU referred to belief. I was simply trying to elaborate on my original position and did that by replying to various possible positions including a possible Bayesian one.
Stephen: It’s still a discrepancy even if it’s in the planning. I am merely trying to distinguish verbally something crucially obvious but for which we informally give different terms: sample stat vs parameter. If we can keep these terms separate, there’s a chance we at least know what we’re talking about. I’m not talking of aims or purposes or roles in the discussion, just a sample space/parameter space distinction.
If you want me to come off the fence, then delta, is a parameter not a statistic. However delta is only a planning parameter. It’s not an inferential parameter. In the purely inferential set up it is has no privileged position whatsoever. It should have no direct effect on your inferential statements, whether Bayesian or frequentist. I usually use the symbol tau to represent the unknown parameter for the treatment effect and tau^ (tau hat) the statistic. When I am in inference mode delta, on the other hand, does not enter into it.
As Corey picked up, if I was going to be fully Bayesian, as a I have been sometimes in some of the work I have done, then delta would be something like one of the anchoring points for utility. In a value of information approach this makes more sense.
So to come back to your point, I think that there are three important distinctions, not two: statistic, inferential parameter, planning parameter.
As regards your original title, this implied that the clinically relevant difference is a difference that your trial has power to detect. This will only be true if you have designed a trial that has significant power. You may have designed a rather inadequate trial. The disease does not change because you don’t have enough resources to study it. (It may be true that lack of resources should lead you to accept higher values of alpha and beta).
Stephen:
“However delta is only a planning parameter. It’s not an inferential parameter. … It should have no direct effect on your inferential statements, whether Bayesian or frequentist.”
But wouldn’t you agree that if you fail to find stat sig, then there’s some evidence for the inference that any underlying discrepancy is < delta? (Assuming POW(delta) = .8 or the like.) And even better evidence the discrepancy < values in excess of delta? Because were it as large as delta, the prob of observing a larger difference than we got is .8?
“The clinical relevance is not what I believe about the drug but what I believe about the disease. If I was going to be Bayesian the clinically relevant difference would become part of my definition of the utility and NOT of the prior belief of the effect of the drug.”
Ah! All becomes clear.
Stephen, this is fabulous and I concur completely with your approach (I also use the “difference you’d hate to miss” approach when working with investigators and, believe it or not, it actually seems to help get them to a reasonable delta). Sometimes, it takes all my effort to talk them out of using previous point estimates (but, but, but, it’s “in the literature”). Also, jumping to interpreting the conclusions of a trial, I bristle at discussions around “statistically, but not clinically, significant.”
I agree with Mark. There are times when you have to take a definite decision. Planning a trial is one of them. You are committed to determining a sample size. One way of looking at the frequentist power calculation is that it targets a signal to noise ratio of a give size, where the noise is represented by the standard error and the signal by the clinically relevant difference. In the ‘difference you would not like to miss’ approach you choose a pretty good signal. However, one should not reify the term ‘clinically relevant difference’.
Once the data are in you go into planning not inference mode. Of course, it would be nice if you had an effect that was as large as the planning delta but it would be quite wrong to suppose that lesser effects are not of interest. Therefore, once the trial is run you present point estimates, confidence intervals, even P-values as part of what you have. Other minds are free to judge the results and there is no need to label them clinically relevant or not.
The title I gave it initially was: “on how to interpret discrepancies against which a test has high power” (Guest Post)
“Also, jumping to interpreting the conclusions of a trial, I bristle at discussions around “statistically, but not clinically, significant.”
@mark – why is that?
Because such discussions almost invariably focus on whether or not the observed point estimate of “treatment effect” is lower than some threshold, either the delta used for planning or some arbitrary post hoc value. It deemphasises the (I think) most relevant conclusion from a “positive” randomised trial, which is that such a trial provides evidence that the test treatment was effective for some people who received it (that is, some people fared better than they would have had they received the comparator), even if we can’t identify precisely who those people were.
Stephen: After several tries to fix the engine of my US Air flight (not me, the US Air people) , I’ve given up, so I’m hanging around an airport waiting for a ride. What better time to look at the blog? (translation: Expect errors.) Let me try to connect to your point referring to my one sided normal testing example. (I will use discrepancy.) The discrepancy we would not like to miss is delta, the value against which you want or set to have .8 power, is that right? So by “not liking to miss” you mean something like, if that difference in treatment exists, I want my significance test alarm to trigger (with a stat sig difference) with prob .8, right?
Of course this doesn’t entitle the estimated discrepancy to be delta or more, once you’ve got the observed stat sig difference. This could be given by the lower confidence bound. Referring to my one-sided test T+ again, perhaps your point might be put this way: Inferring mu > mu’ is entitled when test T+ has LOW power at mu’. So clearly this value differs from and is smaller than a discrepancy delta against which the power is high. Is this right? (The relevant recent post is here:
https://errorstatistics.com/2014/03/12/get-empowered-to-detect-power-howlers/
Of course a barely stat sig result might only allow inferring evidence of some non-zero discrepancy from the null.
I think that we are broadly in agreement but I would like to just establish that we agree on one important point. The usual convention, rightly or wrongly, is that delta is prior to the trial. Thus you establish what delta is and then you design the trial. Given enough resources you should design a trial that will have reasonable power if the true treatment effect is delta. However, whether or not you succeed in designing such a trial delta still is what it was when you first established it. Thus you cannot describe delta as being a difference the particular trial you happened to have designed has power to detect since you might have designed a trial with inadequate power.
Another statistician working on the same disease might have designed a bigger trial. That does not mean that her delta is smaller. It means that her power is larger.
Of course, the above ‘ideal’ position is frequently violated and sometimes delta is made the function of power (one can regard this as being cynical or pragmatic according to taste).
One further point is that many biostatisticians (including me) only think of power as a planning issue. Once the trial is in we are into estimation mode and it is point estimates and confidence intervals we think of.
Stephen: OK, but post-data one can use power or power-like assessments relative to the data obtained. Cox 2006 and Cox and Mayo 2010 characterize it as an appeal to the distribution of the P-value over various hypothesized values. This comes to the same thing as what the pos-data severity assessment does.
In the illustration I was giving, the assessment could use power because we imagined the observed difference was just at the cut-off for rejection. The same reasoning holds substituting for the actually observed difference, or the observed p-value.
One time Greenland asked Cox if using severity (in our paper) wasn’t going against his position on not using power post data, and Cox’s reply (fortunately) was that this was very different.
Of course, any statistician thinks you can use the data to say something about the plausibility of the observed value given any postulated parameter value (frequentist) or vice-versa (Bayesian).
You can, if you want to, construct confidence intervals for a continuously varying level of confidence from (say) 0 to (say) 0.99. Or, for that matter, plot the likelihood as a function of the unknown parameter. Or calculate the severity or calculate a posterior distribution.
Or rather one can do this if one can do it. For many real life problems involving either small samples or nuisance parameters or both, these things are not so easy.
I don’t really like power calculations once the trial is in but this may be a matter of taste rather than logic.
See also http://onlinelibrary.wiley.com/doi/10.1002/sim.743/abstract for further ‘paradoxes’ of confidence and power.
Stephen: I don’t think you’re getting my point. Never mind jumbling together all kinds of ways one can make inferences about parameters with data. I’m saying there is a rationale to the pattern of reasoning in just the kind of case we’re considering here (and others of course). Forget the word power if you don’t like it. You look to see what discrepancies the test was capable and incapable of detecting, where detecting means it triggers the “stat sig alarm bell”. If the test was incapable of producing such a loud or impressive alarm bell as we see going off, if in fact mu is not greater than mu1, then the bell is a good indication (or evidence) of mu > mu1.
(“Low capability” corresponds to “low power”, but we’re dropping the word power.)
We don’t want to just throw together all kinds of inference patterns that might be employed to reach claims about evidence of discrepancies. I’m interested in isolating and explaining the logic underlying significance tests, confidence intervals etc—or better, I’m articulating “a logic” that not only makes sense of them, but which illuminates their properties, and the kind of scientific reasoning to associate with them. Trying to view them from the tunnel of other modes of reasoning is what leads to misinterpretations and lack of right use. In short, I’m doing philosophical work, or trying.
Deborah: I don’t think you are getting my point. It’s not the word power I don’t much like but the concept. I have already explained that I think that the Neyman-Pearson lemma is back to front and that likelihood is primary and power is secondary. I think that you feeel the reverse but I am sure that I am not going to convince you by dropping the name ‘likelihood’ and replacing it by something else.
Hypothesis/significance testing is only a small part of what we do. We tend to use it as much for sociological as for logical reasons: regulators expect to see some level of ‘proof’ that the treatment has some effect and so we give it to them.
Behind such a test is always the idea that somebody will make a decision. The fact that we often don’t just say significant not/significant but give a P-value as well permits each remote scientist to make his or her own decision but it’s still conceptually a decision.
However, such decisions can rapidly lose their relevance as new studies come in. There may be no new studies if the result was not significant by regulatory standards but if it was there will be and the old study will have to be included with the new.
Thus, once the trial is in it provides evidence in the form of point estimates and standard error that statisticians (and others) will often combine in the form of a meta-analysis to make statements about the treatment effects. Although individual trials can be combined using P-values, in practice nobody ever does it that way if they can avoid it.
The reason I objected to the re-titling of the post was that the idea behind my post was that the clinically relevant difference was primary (historically – it usually comes first) and the power was secondary.
So let me give you another analogy to your (very interesting) fire alarm analogy (My analogy is imperfect but so is the fire alarm.) If you want to cross the Atlantic from Glasgow you should do some serious calculations to decide what boat you need. However, if several days later you arrive at the Statue of Liberty the fact that you see it is more important than the size of the boat for deciding that you did, indeed, cross the Atlantic.
However, I have taken on board your point (previously) that David Cox corrected Sander Greenland’s view of what he (David) meant about power. I may have made a similar mistake in the past, as you can see from this. Here is a letter to the editor of the BMJ in which I quoted David Cox on power http://www.ncbi.nlm.nih.gov/pmc/articles/PMC1124761/ .
Stephen: Too many interesting points in your comment to cover, so here’s a remark on just one for now:
(1) “The reason I objected to the re-titling of the post was that the idea behind my post was that the clinically relevant difference was primary (historically – it usually comes first) and the power was secondary”.
Power officially enters for planning, and I don’t see how one can plan to design a test with high power of detecting a discrepancy of interest without already having an idea of what that discrepancy is. So I agree, and I’m not getting the thrust of your point, nor how my initial title enters. Did you think I had in mind that one forms the test and afterwards looks to see the alternative against which the test has high power and THEN declares that’s the alternative that’s clinically relevant? That’s rather silly. I only wanted to emphasize this post had to do with power and not Star Wars.
It’s too bad you’re not seeing the important points we’re agreeing on, Stephen—because these are the points that people are most confused about. For example, we agree that a stat sig rejection does not mean you’ve shown mu > mu’, where mu’ is a discrepancy against which the test has high power. This is often gotten wrong by others! For example the popular movement to look at “science-wise error rates”, as well as the “reformers” who view alpha/power as a kind of likelihood ratio for a Bayesian prior.
Deborah: I agree that we agree on many things. One we disagree about is what the tools for the post-trial investigation should be. I like likelihood, and (I think) you don’t.
I certainly agree with this “For example, we agree that a stat sig rejection does not mean you’ve shown mu > mu’, where mu’ is a discrepancy against which the test has high power.”
In fact there is a general misunderstanding about the nature of alternative hypotheses. For an example see my comment on a famous meta-analysis of rofecoxib under “Inappropriate pooling of treatments” http://www.biomedcentral.com/1471-2288/9/10
Stephen: OK, let me isolate this point of agreement for the future:
I certainly agree with this “For example, we agree that a stat sig rejection does not mean you’ve shown mu > mu’, where mu’ is a discrepancy against which the test has high power.”
Sorry. Should probably have emphasised this earlier. Obviously I agree with this and it’s so obvious that I perhaps overlooked stating it.I think that the vast majority of biostatisticians would agree with this (and any who don’t are just wrong).
However, I think that there are some proponents of Neyman type restricted tests who come close to proposing something similar.
Stephen. Now for a second point: your boat for crossing the Atlantic.
(2) “if several days later you arrive at the Statue of Liberty the fact that you see it is more important than the size of the boat for deciding that you did, indeed, cross the Atlantic”.
A crucial disanalogy arises: You see the statue and you see the observed difference in a test, but even when the stat sig alarm goes off, you are not able to see the discrepancy that generated the observed difference or the alarm you hear. You don’t know that you’ve arrived (at the cause). The statistical inference problem is precisely to make that leap from the perceived alarm to some aspect of the underlying process that resulted in the alarm being triggered. Then it is of considerable relevance to exploit info on the capability of your test procedure to result in alarms going off (perhaps of different loudness), due to varying values of an aspect of the underlying process mu’, mu”, mu”’, …etc..
Using the loudness of the alarm you actually heard, rather than the minimal stat sig bell, would be analogous to using the p-value rather than the pre-data cut-off for rejection. But the logic is just the same.
Deborah, thanks and I agree about my analogy. In fact I had exactly the point you had in my mind when I said “My analogy is imperfect” but you seem to have missed that I also said “but so is the fire alarm”. So what’s sauce for the goose is sauce for the gander. Here’s how the fire alarm analogy needs to be modified.
A fire engineer (FE) is called in to quote for a fire alarm and has a meeting with the the personnel officer (PO) and the chief financial officer (CFO). He explains that he can design a system but he can’t guarantee that it will never go off when there is no fire. The CFO say he doesn’t want it to go off too often because if he calls the fire brigade he gets billed. The PO say she is concerned about the staff and wants to make sure that they are safe.
The FE says,”here’s what I can do. The PO tells me what size of fire it would be dangerous to miss and I can design a system to go off with high probability when there is such a fire and to go off with low probability when there isn’t. ”
The CFO says ‘so the definition of a fire it would be dangerous to miss is that it’s one you can detect.’
The FE says, ‘well that’s back to front. That implies that what constitutes a serious fire is a function of the alarm system. Most people would say it depends on the building and the people who have to work in it.’
A specification for the system is agreed and the The FE returns for a second visit with a quotation.
The CFO says, ‘so much!!? Can you guarantee that it won’t go off just because somebody burnt the toast?’
‘Unfortunately not,’ says the FE ‘ I can design a system that has a low probability of going off if only the toast is burning but to keep the PO happy it’s then going to have to be much bigger and more expensive. Bear in mind, however, that the system is designed to trigger an alarm for the staff. You can then initiate further investigations before calling the fire brigade. Obviously, if the alarm doesn’t go off you won’t be able to initiate any further investigations.
‘I should perhaps also explain the way the system works. It’s built on many detectors because actually not only are individual sensors unreliable but we have an imperfect knowledge of how reliable they are. What happens at any given moment is that the system polls the sensors, takes the average result and the extent to which the sensors agree with each other (from which we calculate what we call the noise) and uses them both to reach a decision. However this actually delivers a bonus. It means that at any time we can not only tell you what the actual signal was and what the noise was and what the signal to noise ratio was but we can also give you a handy little graphical representation. This plots the probability of the actual average signal given as a function of a fire of any possible magnitude bearing in mind the estimate of the noise. We call this a likelihood plot.’
CFO says ‘I don’t like the idea of the likelihood plot. Whenever I hear the alarm I’ll just think about toasters and their ability to set off signals even larger than the one I have.’
Stephen: There’s nothing wrong with the likelihoods, where you have them, but you still have to say how we reach an inference having eye-balled the massive likelihood plot.
Stephen: You are/were right about what Cox said, but he regards what I/we were doing wrt severity as different. Maybe he and others were reacting to a different fallacy.
Eyeballing a massive plot is not a problem for applied statisticians. In fact for most of them (including me) there’s a problem coming to an inference if they can’t plot something. I would certainly want a massive severity plot.
However, thinking about it some more I suspect that in many cases there is a very close relationship between likelihood ratio and severity.
The reason I say this is because there is a very close relationship between P-values and likelihood.
If that is so what would be interesting would be to investigate cases where severity and likelihood disagree.
This reminds me that, when I have time I must blog something on bioequivalence.
Stephen: Pretty sure David Cox would insist on a frequency calibration of any likelihood plot or would suggest it is not really worth looking at.
(A rough quote of what he said about some likelihood plots I had worked on.)
Keith: Can you say a bit more? And did you provide it?
The plots were an earlier version of this stuffhttp://andrewgelman.com/2011/05/14/missed_friday_t/
One can get a rough sense of the sampling distribution with simulation, but I think he was suggesting higher order asymptotics which my adviser told me would be way too difficult (e.g. things like inverting characteristic functions of multiple parameters based on a single observation.)
The bigger problem with the plots is that even most statisticians have little grasp of likelihood functions more than simple techniques like MLEs and LR tests. I do try to provide some of that background in the paper, but apparently to obscure for those without the background while trivial to journal editors.
The Likelihood Principal plays no role here (though I agree with Mike Evans that is vacuous) – its just paying attention to the data generating model and the data in hand – not claiming equivalences between inferences (which should not be treated as equivalent).
Keith: While a side issue of your comment, I must clarify that Mike Evans didn’t show the LP was vacuous, it’s extremely contentful! No one thinks it’s vacuous. I, on the other hand, show that Birnbaum’s argument for it is vacuous (in the sense of question-begging) or unsound. I wonder how that got mixed up.
May have not gone through
The plots were an earlier version of this stuffhttp://andrewgelman.com/2011/05/14/missed_friday_t/�
One can get a rough sense of the sampling distribution with simulation, but I think he was suggesting higher order asymptotics which my adviser told me would be way too difficult (e.g. things like inverting characteristic functions of multiple parameters based on a single observation.)�
The bigger problem with the plots is that even most statisticians have little grasp of likelihood functions more than simple techniques �like MLEs and LR tests. I do try to provide some of that background in the paper, but apparently to obscure for those without the background while trivial to journal editors.�
The Likelihood Principal plays no role here (though I agree with Mike Evans that is vacuous) – its just paying attention to the data generating model and the data in hand – not claiming equivalences between inferences (which should not be treated as equivalent).�
Keith: Please look up SLP on this blog to see more. But the LP is anything but vacuous.It’s so strong as to rule sampling distributions in informative inference.
Stephen: I’d love for you to do that (write on bioequivalence) and we can even read it in our seminar.
I think one place LRs would differ from severity are cases where the Likelihood Principle fails. Moreover, there’s the style of reasoning that differs. Likelihoods are all about which parameters “fit” the data best. SEV, it seems to me, is more in sync with what you are saying in your most recent post.
Stephen: I’ve really found it valuable to reread this discussion (and now I shall have to change slightly something in my new book). I will call attention to this discussion in our current July 30, 2015 blog, but having been swept up in reacting to your analogy at the time, I overlooked wanting to see what you meant. We could have talked about this in NYC!
Senn’s post, now that I think I understand it, is very much in sync with my post:
https://errorstatistics.com/2014/03/12/get-empowered-to-detect-power-howlers/
In that one-sided (upper) test T+ with null of 0, and letting D* be the observed difference that just reaches the desired (low) value of stat sig (say .03), you want any stat sig outcome to enable inferring mu> w, where we let w stand for Senn’s the discrepancy you Want to “show” (he says prove), on the basis of a stat sig result. I’d say it is the discrepancy you want to infer on the basis of D*.
Letting D* be the 2-standard deviation cut-off again, for simplicity, the alternative against which the test has high power (say .84) exceeds 0 by 3 standard deviations. (Easy to remember). By contrast, getting even to a .93 lower confidence limit requires subtracting 1.5 standard deviations from D*. So Senn’s delta requires adding something to D* and w requires subtracting from D*. So clearly w < D*.
e.g., w = .5 standard deviations from 0, while delta = 3 standard deviations up from 0.
Note POW(w) = low , e.g., .07, while POW(delta) = high, e.g., .84, thereby instantiating my point in that recent blog–all referring to test T+.