
S. Senn
Stephen Senn
Head of Competence Center for Methodology and Statistics (CCMS)
Luxembourg Institute of Health
Double Jeopardy?: Judge Jeffreys Upholds the Law
“But this could be dealt with in a rough empirical way by taking twice the standard error as a criterion for possible genuineness and three times the standard error for definite acceptance”. Harold Jeffreys(1) (p386)
This is the second of two posts on P-values. In the first, The Pathetic P-Value, I considered the relation of P-values to Laplace’s Bayesian formulation of induction, pointing out that that P-values, whilst they had a very different interpretation, were numerically very similar to a type of Bayesian posterior probability. In this one, I consider their relation or lack of it, to Harold Jeffreys’s radically different approach to significance testing. (An excellent account of the development of Jeffreys’s thought is given by Howie(2), which I recommend highly.)
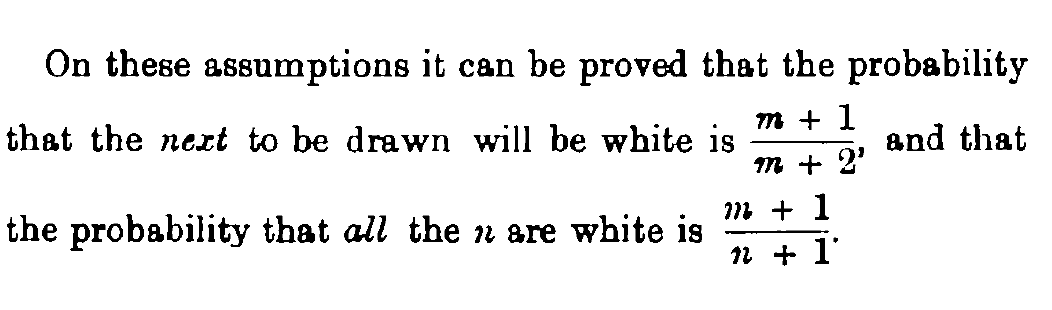
The story starts with Cambridge philosopher CD Broad (1887-1971), who in 1918 pointed to a difficulty with Laplace’s Law of Succession. Broad considers the problem of drawing counters from an urn containing n counters and supposes that all m drawn had been observed to be white. He now considers two very different questions, which have two very different probabilities and writes:
 Note that in the case that only one counter remains we have n = m + 1 and the two probabilities are the same. However, if n > m+1 they are not the same and in particular if m is large but n is much larger, the first probability can approach 1 whilst the second remains small.
The practical implication of this just because Bayesian induction implies that a large sequence of successes (and no failures) supports belief that the next trial will be a success, it does not follow that one should believe that all future trials will be so. This distinction is often misunderstood. This is The Economist getting it wrong in September 2000
The canonical example is to imagine that a precocious newborn observes his first sunset, and wonders whether the sun will rise again or not. He assigns equal prior probabilities to both possible outcomes, and represents this by placing one white and one black marble into a bag. The following day, when the sun rises, the child places another white marble in the bag. The probability that a marble plucked randomly from the bag will be white (ie, the child’s degree of belief in future sunrises) has thus gone from a half to two-thirds. After sunrise the next day, the child adds another white marble, and the probability (and thus the degree of belief) goes from two-thirds to three-quarters. And so on. Gradually, the initial belief that the sun is just as likely as not to rise each morning is modified to become a near-certainty that the sun will always rise.
See Dicing with Death(3) (pp76-78).
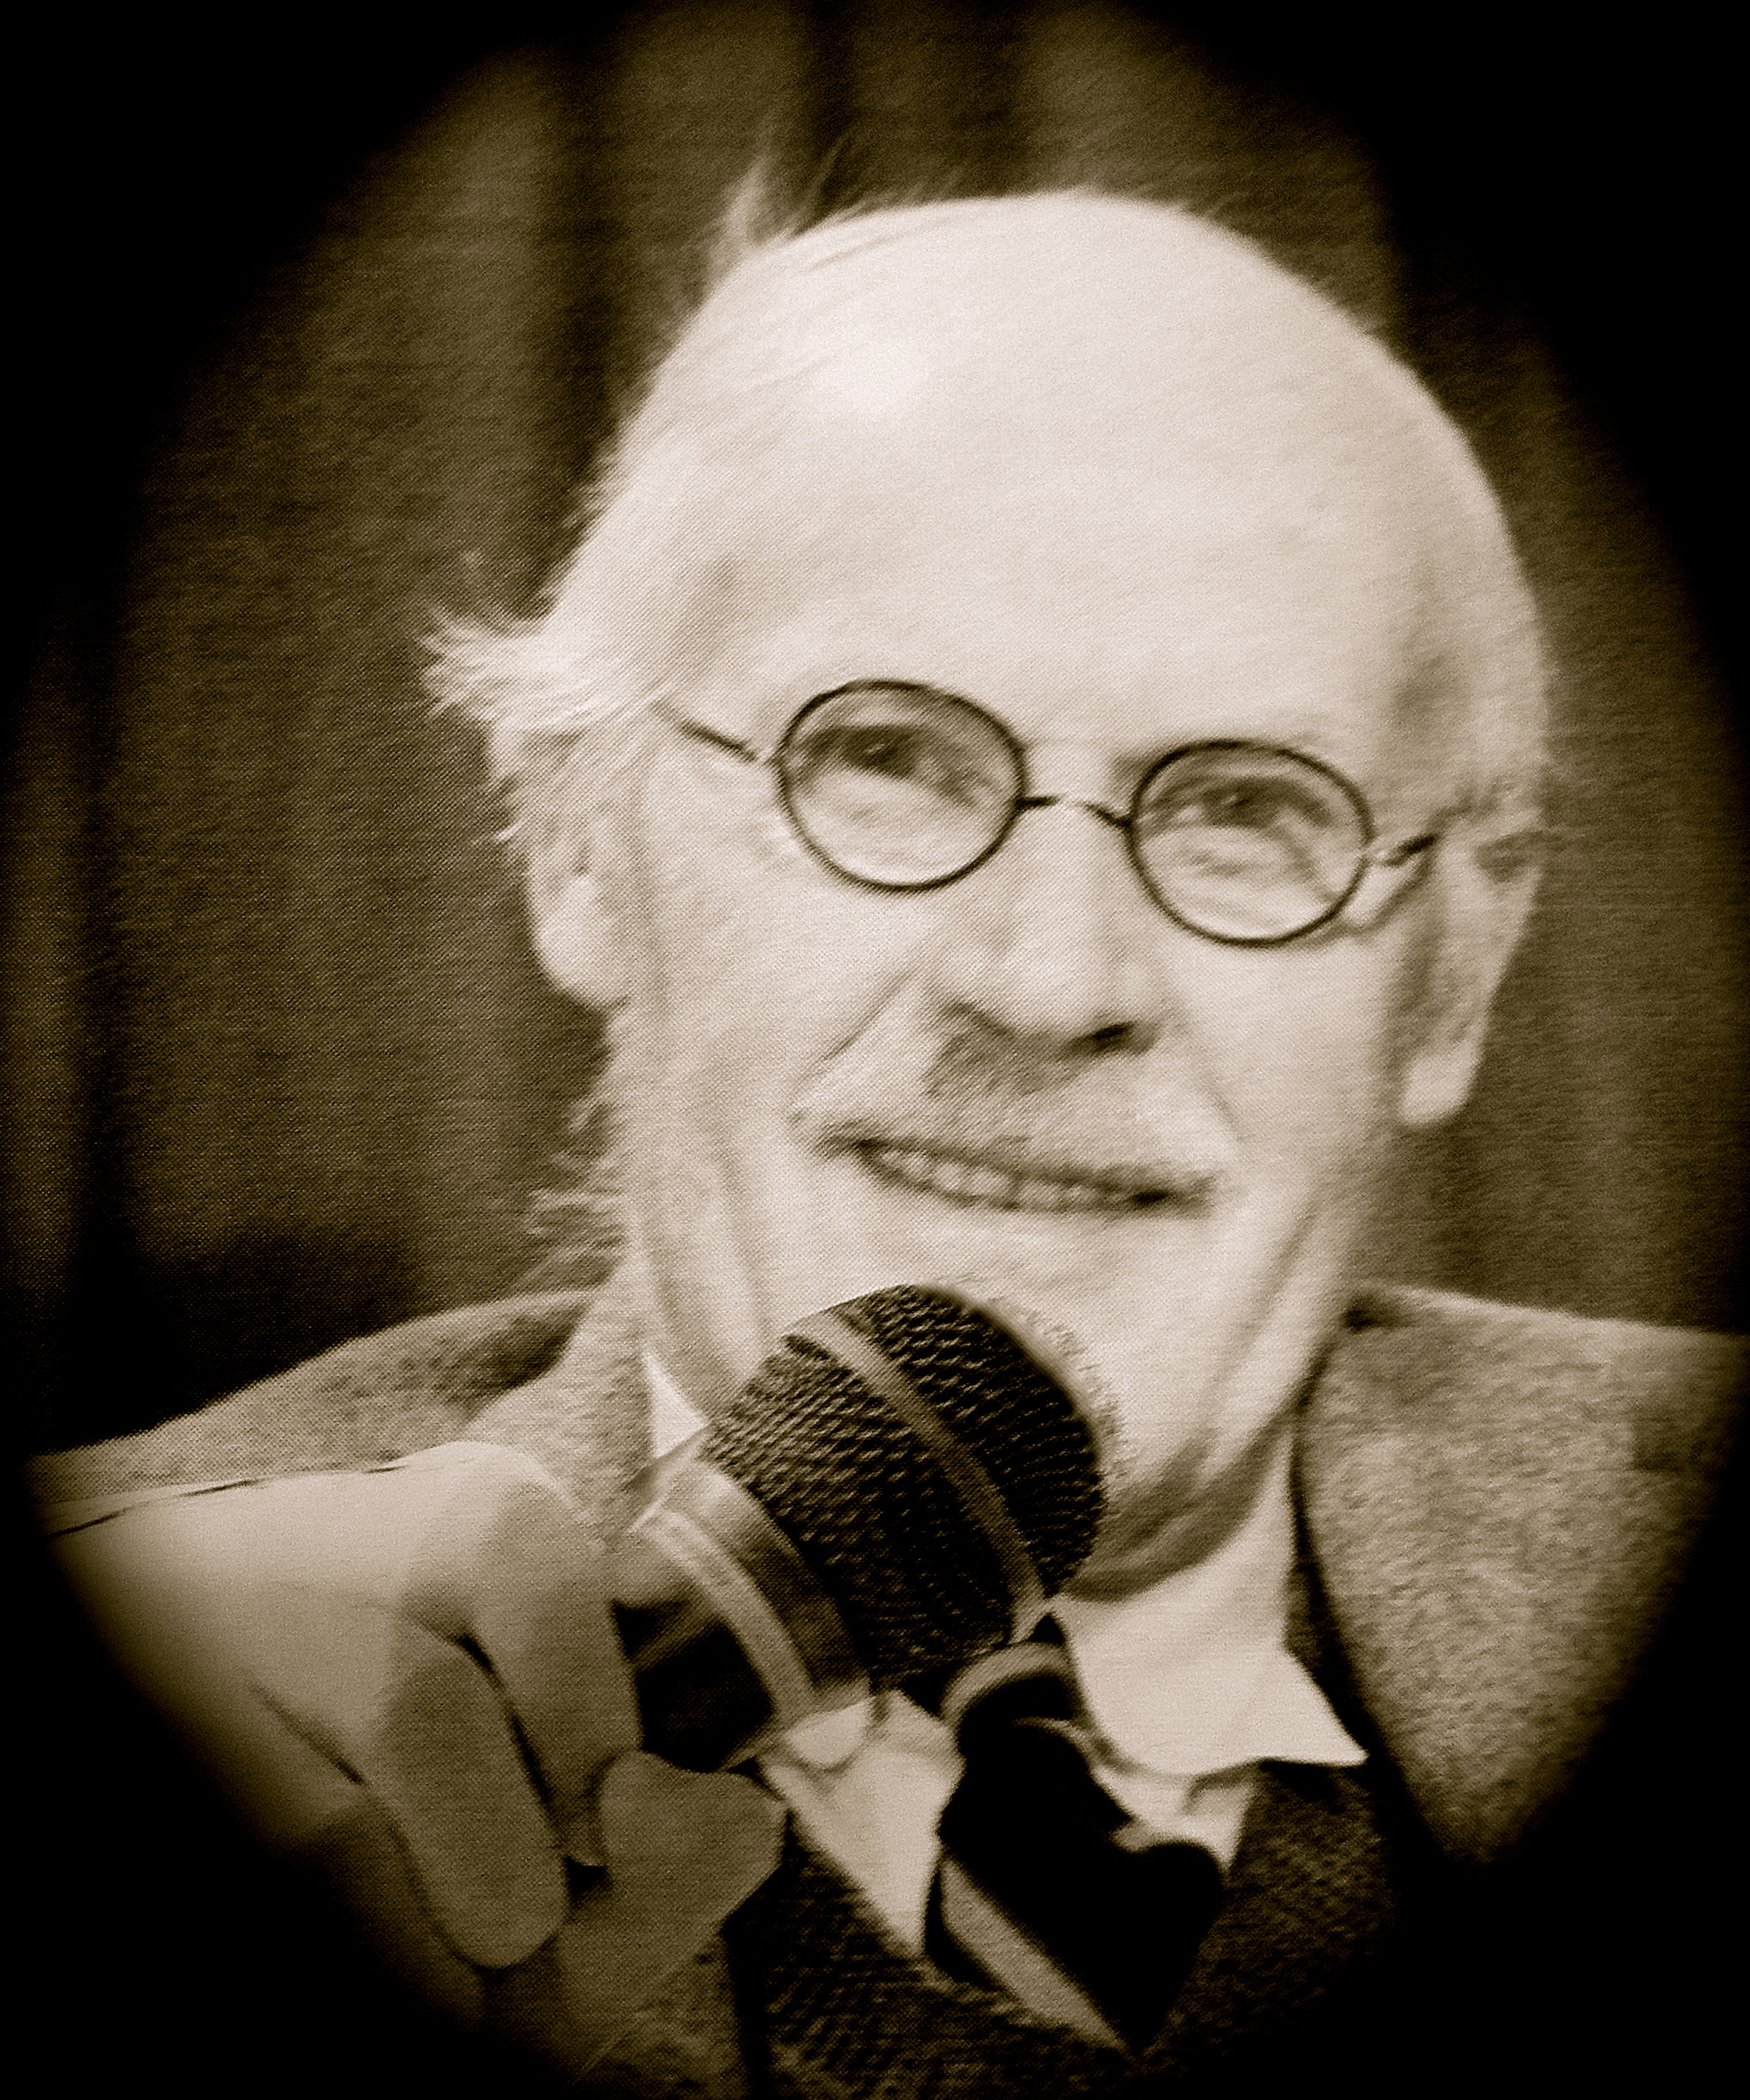
The practical relevance of this is that scientific laws cannot be established by Laplacian induction. Jeffreys (1891-1989) puts it thus
Thus I may have seen 1 in 1000 of the ‘animals with feathers’ in England; on Laplace’s theory the probability of the proposition, ‘all animals with feathers have beaks’, would be about 1/1000. This does not correspond to my state of belief or anybody else’s. (P128)
Continue reading →


")


Power taboos: Statue of Liberty, Senn, Neyman, Carnap, Severity
My fire alarm analogy is here. My analogy presumes you are assessing the situation (about the fire) long distance. Continue reading →