
 Karthik Durvasula, a blog follower[i], sent me a highly apt severity app that he created: https://karthikdurvasula.shinyapps.io/Severity_Calculator/
updated June,
I have his permission to post it or use it for pedagogical purposes, so since it’s Saturday night, go ahead and have some fun with it. Durvasula had the great idea of using it to illustrate howlers. Also, I would add, to discover them.
It follows many of the elements of the Excel Sev Program discussed recently, but it’s easier to use.* (I’ll add some notes about the particular claim (i.e, discrepancy) for which SEV is being computed later on).
*If others want to tweak or improve it, he might pass on the source code (write to me on this).
[i] I might note that Durvasula was the winner of the January palindrome contest.


")


Nifty teaching tool, Thanks ! BUT . . . nothing happens when I plug in numbers. NOTHING happens. Where is the “go” button on this thing ?
James: I don’t know why you’re having trouble, it works whenever I plug in numbers.
James: It works on Firefox/Chrome/Safari. I didn’t test it on Internet Explorer, so if you are using that then perhaps try one of the others. If this is not the problem, I really am not sure what could have gone wrong. Perhaps, it is some server side issue related to the hosting website (shinyapps).
Problem solved. When I iuse Google Chrome as the browser (instead of Internet Explorer) the program works perfectly.
Use, not iuse; so excited that it works I was stuttering.
Is there an error in the calculation of severity in case of a rejection of the null? I thought the probability in that case was based on the distribution under the null, not the alternative. The alternative has no bearing on the severity of a rejection, right?
John: We may have put it up prematurely. I assumed he followed the Excel program. We’ll put it back after it’s debugged and checked.
I’m glad to see this tool, and I have a few suggestions.
First, explain the terms. Sigma is probably OK as is, but alpha, severity, etc, need to be defined or explained. The Notes tab would be a good place for this. Even if everyone wanting to try the tool more or less know the meaning of the terms, they may not understand them the same way as *you* do.
Second, the graphics elements don’t work well for people (like me) with color vision deficits:
– With red-green color blindness (the most common; I have it to a degree), it’s hard to impossible to discriminate, e.g., orange from green. With thin lines that’s even more the case. Ways to help with this:
a. Choose color pairs such as blue-green that are more likely to be discriminated. Most red-green deficient people can see blues, while blue-yellow deficient people can discriminate reds and greens. Using one color from one pair, and another from the other pair, are likely to work well. I often use black, gray, and light gray.
b. Use different line styles, such as solid vs dashed, or thicker vs thinner.
c. Use different color saturation. This will only be effective for a few large differences, but can be helpful. E.g., black vs gray.
d. more colored area is helpful, e.g., wide lines vs thin lines.
You won’t be able to make all graphs work for all people with color deficits because there is such a range of conditions. But the suggestions above will really help most of us, and for very little effort on the part of the designer.
Thank you.
Tom: Please check the SEV excel program in the mean time. Sorry for any confusion, not sure about colors.
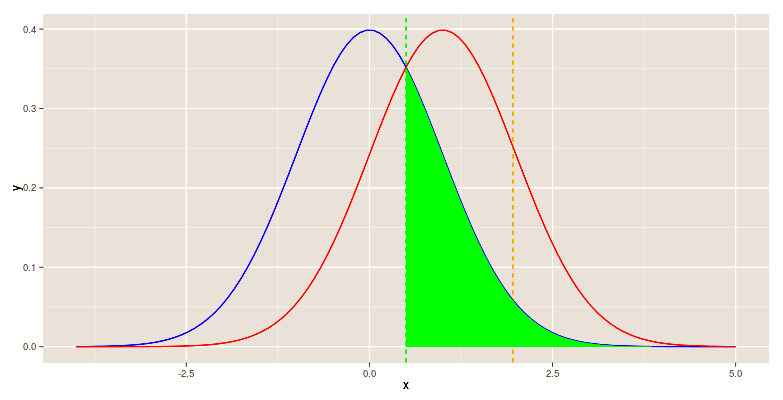
@John: The original version that I put up was identical to the excel version. The SEV calculation for the “rejection” case is as you will see in the excel calculation not based on the distribution under the null, but based on the alternative. I was surprised by it too, but I decided to follow the excel program because I didn’t trust my own understanding. I am currently re-reading “Error Statistics” to follow that reasoning. In fact, you can plug in the following values into the excel calculator, mu0=12, mu1=12.8, xbar=12.5, sd=2, N=100, alpha=0.025. It gives you a “Reject”, and you can see that the SEV calculation highlights the area under the mu1 density curve below xbar (in red horizontal lines). I don’t quite follow why still.
@Mayo: I looked at pg. 176 of Error Statistics, case 2 where mu0=0.8, and mu1=0, and x-bar = 0.4, the SEV in the paper is given to be 0.977 (which is the understanding I have and John has). However, when I plug in the equivalent values (it won’t accept 0.8,0 for some reason…) mu0=12.8, mu1=12,xbar=12.4, sd=2,N=100, the program gives me 0.02275. Is there a bug in the excel file, or am I misunderstanding something here?
Karthik: Stuck in traveling locations. I think I mentioned that the SEV excel program has limited range, which was why I liked yours. The numbers you gave me are correct for SEV (mu > 12.8) based on X-bar = 12.4.
To infer mu > 12.8 on the basis of X-bar = 12.4 has severity of ~.023. If mu were as great as 12.8, 98% of the time you would get a larger X-bar than you did. This is like making great whales out of goldfish. You found something but to infer so large a discrepancy is unwarranted. You have to be careful to look at the form of the claim you wish to entertain in order to get the relevant severity correct.
It seems that the spreadsheet is correct for a severity calculation to warrant acceptance, as this requires the use of a distribution under some alternative. But when one wants to provide a severity calculation for rejecting the null, it is simply 1 – p-value.