
Polling estimation & rubbing off
Nate Silver describes “How we’re forecasting the primaries” using confidence intervals. Never mind that the estimates are a few weeks old, and put entirely to one side any predictions he makes or will make. I’m only interested in this one interpretive portion of the method, as Silver describes it:
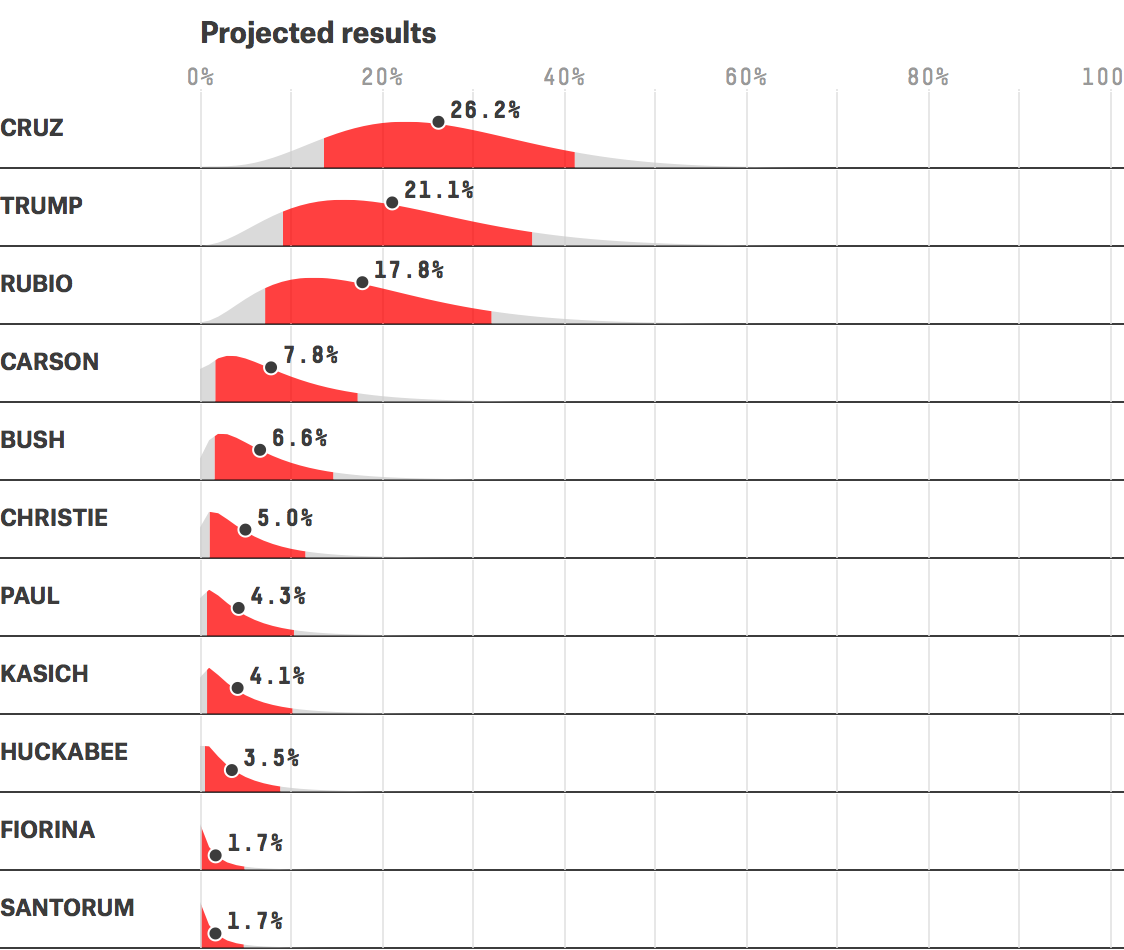
In our interactive, you’ll see a bunch of funky-looking curves like the ones below for each candidate; they represent the model’s estimate of the possible distribution of his vote share. The red part of the curve represents a candidate’s 80 percent confidence interval. If the model is calibrated correctly, then he should finish within this range 80 percent of the time, above it 10 percent of the time, and below it 10 percent of the time. (My emphasis.)
OK. But when we look up the link to confidence interval, this seems to fall squarely within (what is correctly described as) the incorrect way to interpret intervals.
Statisticians use a confidence interval to describe the amount of uncertainty associated with a sample estimate of a population parameter. (my emphasis)
How to Interpret Confidence Intervals
Suppose that a 90% confidence interval states that the population mean is greater than 100 and less than 200. How would you interpret this statement?
Some people think this means there is a 90% chance that the population mean falls between 100 and 200. This is incorrect. Like any population parameter, the population mean is a constant, not a random variable. It does not change. The probability that a constant falls within any given range is always 0.00 or 1.00.
The confidence level describes the uncertainty associated with a sampling method. Suppose we used the same sampling method to select different samples and to compute a different interval estimate for each sample. Some interval estimates would include the true population parameter and some would not. A 90% confidence level means that we would expect 90% of the interval estimates to include the population parameter; A 95% confidence level means that 95% of the intervals would include the parameter; and so on.
Everything, with the possible exception of the bold portion, is quite clear: the probability characterizes the performance of the estimation method. What I’m wondering is how Silver’s glossary definition underwrites his claim:
If the model is calibrated correctly [2], then he should finish within this range 80 percent of the time, above it 10 percent of the time, and below it 10 percent of the time.
“This range” would seem to refer to a particular estimate, but then Nate’s interpretation is that there’s an 80% chance that the population mean falls between the specific lower and upper bound, above it 10 percent of the time, and below it 10 percent of the time. Yet this is what his glossary definition of confidence intervals correctly calls an incorrect construal.
What do you think’s going on?
Even though his construal violates (or appears to violate) his own warning about incorrect interpretations, the bold portion of the definition is equivocal. The bold portion alludes to what I call a “rubbing off” construal of a method’s error probability: If the particular inference—here an interval estimate—is a (relevant) instance of a method that is correct with probability (1 – α), then the (1 – α) “rubs off” on the particular estimate. What’s supposed to “rub off” according to Silver?
Following Silver’s glossary, we might try on the idea that it’s “the degree of uncertainty” (in the interval) that’s rubbing off. A more common construal is in terms of degree of “confidence”. (Should we prefer one to the other? Both are vague and informal.) Neither quite warrants his construal. The severity construal of a confidence level allows it to qualify how well (or poorly) tested various claims are. But this too differs from the illicit probabilistic instantiation Silver reports.
[1] See, for example, “Duality: Confidence intervals and the severity of tests”.
[2] The model being calibrated correctly, I take it, refers to the model assumptions being approximately met by the data in the case at hand.


")


It’s not uncommon that Bayesian credible intevalls are called confidence intervalls, I believe that’s what Nate have done here.
Rasmusab: Even if that’s so (though I’ve never seen it) that’s not how they’re defined in his own link to the definition being used.
I agree that that link is puzzling, maybe there was some disconnect between the person who wrote the model and who wrote the info text… Just looking at the plot of distributions it looks like Bayesian posterior distributions to me, which means that the intervals should be credible intervals, right?
The disconnect between linked glossaries and instructive on-line articles on statistics that link to them, occurred in Frost’a minitab blog https://errorstatistics.com/2016/01/19/high-error-rates-in-discussions-of-error-rates-i/
But he absolutely refused to see it, let alone change it. My guess is that is not what’s happening with Silver. Given all that Silver has written, I think he should wish to clarify.
For various reasons I prefer the term uncertainty interval.
Andrew: Interesting. I always feel that “uncertainty” is an equivocal term, and of course I dislike its seeming to evoke an agent’s feelings of certainty. I guess it might be thought to work with CIs like this: I’m 5% uncertain the result of using this method of estimation will be correct, so when I instantiate, I report that. (rubbing off).
I actually don’t like either, but confidence at least has a very long history. It’s a tip-off that it’s a fallacy to instantiate the probability (as Fisher wanted to in the case of Fiducial probability).
I’m in favor of using statistics to characterize how well or poorly warranted claims are based on their well-testedness. I find it natural to say, I’m rather certain of C, but these data/method have done a poor job in warranting C. Corroboration or severity captures that better–it’s not in me, it’s what’s been accomplished well or poorly. I should add that not just any interval estimation procedure with good coverage properties affords this.
So, aside from all that, what’s Silver doing?
Here is what I think he’s doing:
* The plot shows probability distributions over a one-off event (the result of the primaries), so he must be using a Bayesian model.
* There are two common ways to summarize a posterior distribution using intervals. Highest density intervals and quantile intervals, and the intervals in the plot looks like 80% quantile credible intervals to me. That is, you chop off 10% of the probability in each tail and what you are left with is the interval.
* The point estimates are clearly not MAP (maximum a posteriori probability) estimates, the Bayesian “analogue” to maximum likelihood estimates. So that boils it down to either the mean posterior or the median posterior, but which it is I cannot tell.
Then, confusingly, he links to the definition for confidence intervals. But with some Bayesian know-how I don’t think it is that confusing what he has done.
Rasmusab: I don’t get your first point. On your last point, that’s the issue at hand. There’s no reason he wouldn’t explain the Bayesian procedure if that’s what’s being used at this stage of the analysis, which is my interest.
So, since it seems hes using probability distributions to represent uncertainty regarding a one-off outcome, then he must be using a Bayesian interpretation of probability, thus he’s using a Bayesian model. Also, if he used a frequentist model he would probably get out point estimates (and possibly interval estimates), but not probability distribution over a future, unknown event, right?
Maybe he didn’t explain the full procedure because he thought it too involved for a blog post, and then (I certainly agree, confusingly) he tried to hand-wave away the explanation of what he did by erroneously referring to the definition of confidence intervals.
Rasmusab: If he wanted to give a probability of a single future event, he would not say “above it 10 percent of the time, and below it 10 percent of the time”. there would be no “of the time”.
I think a better explanation is that he really does mean confidence intervals, and this was just a too-hasty (strictly incorrect) way to describe what they entitle you to say, perhaps assuming the confidence interval link would do the trick and correct things.
There are two non-trivial reasons I care about this, I’m not just nit-picking. I didn’t want to bring them out right at the start lest I bias discussion.
Mayo:
In answer to your last question: Silver’s making predictions, and he’s correct to emphasize that they’re probabilistic. I wouldn’t worry about the details of how he presents them; he doesn’t have statistical training and so he, quite reasonably, acts as a practitioner. It doesn’t seem appropriate to put any more of a burden on his writings.
Andrew: Wait, what? We needn’t be concerned about his use of confidence intervals (or other statistical methods) because “he doesn’t have statistical training and so he, quite reasonably, acts as a practitioner”? In like spirit, we shouldn’t worry when practitioners report P-values as posterior probabilities because they’re just acting as practitioners, and don’t have enough statistical training? Even if these very same “practitioners” set themselves up as arbiters of which statistical methods we’re allowed to use and how to interpret them?
When journal editor Trafimow says that statistical hypothesis tests are “invalid” because they don’t supply posterior probabilities, he is assuming they purport to do so, which is wrong. Instead they provide probabilities that only apply to the testing method, just as with confidence levels, in Silver’s glossary. Shall we say since Trafimow lacks statistical training, we shouldn’t be concerned with the fact that he’s prohibiting papers in his journal from using a method he misunderstands? When Silver’s book ridicules “frequentist” methods–never mind that his own methods are frequentist– it has a big impact. Who is telling the people impacted that they shouldn’t have taken him to heart because he lacks the training? Maybe some people think correction is in order.
Popular spokespeople, journal editors, etc. have an increasingly big impact on which methods are endorsed, and which are banned, and how to interpret them–whether or not they’re properly trained. It wouldn’t be necessary to put “more of a burden” on their writings if they weren’t putting a burden on other people’s research.
I understand your interest in the philosophy of intervals, but the careless use of the term `confidence interval’ is hardly new. Neyman himself admitted to a period of confusion in which he assumed that his confidence intervals were identical to Fisher’s earlier published intervals that Fisher called fiducial.
Neyman, J. (1941), Fiducial Argument and the Theory of Confidence Intervals, Biometrika, 32 (2), 128-50.
My guess is that the relevant type of interval is a prediction interval rather than a confidence interval, but I am not at all disturbed by the use of the latter be it either a mistaken label or a mistaken choice of calculation method. I would look at the fact that the model used seems to yield far too high a likelihood for zero votes for the candidates, and the possibility that the point estimates appear in the figure to be other than the maximum likelihood point, and the possibility that the model assumes the outcome is a fixed parameter when it will be a fixed point after the poll has been conducted, but is currently either non-existent or varying with every new weird and wonderful statement of craziness from the candidates.
I’m pretty sure that Silverman uses a Bayesian updating scheme, so the intervals are probably as Rasmusab says.
Yes, Neyman couldn’t believe right at first that Fisher was making such a blunder! But within a year or two he had no choice but to recognize Fisher’s strange mistake. Neyman was basically offering Fisher a way to make sense out of his fiducial intervals. Unfortunately, Fisher never seemed to get or admit it. It’s a hidden source of most of the misunderstanding about N-P vs Fisher.
As for Silver’s interval, I too expected a Bayesian twist at some point (e.g., some probabilistic prediction down the line), but at THIS point, the reference is only to confidence intervals. Surely he wouldn’t be assuming an uninformative prior here to match confidence levels.
I agree that the bumb at zero is strange. Some of their other plots do not just have a lot of mass close to zero but even bimodal distributions, e.g., in the predictions for Nevada. Perhaps they are trying to accounts for the possibility that a candidate drops out before the primary?
Actually I wasn’t objecting to that, he explains the reasoning in his post.
My comment was in response to Michael. But you are right, it’s actually explained in the post: yes, the bumps close to zero account for drop-outs.
I think Silver uses the frequentist counterfactual argument, though he seems unaware of his frequentist underpinning. The argument is something like: If we were to repeat an experiment where we sampled voters repeatedly (and randomly, etc.), then 80% of the experiments would yield the correct proportions of votes received by the candidates from the population.” This, of course, assumes people will not change their minds after each polling. This latter issue raises in my mind the often neglected issue, What is the reference class? It seems to me the reference class is voter preferences during the period of polling, and not voter preferences on election day ( unless the period of polling includes that day).
But, I work with dead people, so tell where I am wrong.
John. But this frequentist construal is what’s given in his glossary defining confidence interval. I think you’re referring to another issue of importance (that we’ve heard from other sources, not this article): Silver claims to be horrified by frequentist methods even though the bread and butter of his polling work is frequentist. This came to my attention in Wasserman’s review of Silver’s book. It’s likely due to his assuming (in his book) that frequentist methods = a cookbook use of p-values. But here it’s just ordinary CIs.
Silver seems to be frequentist of the Von Mises type, but claims to be a Bayesian. He is hard to follow.
I suspect Silver’s is just somewhat vague about what he means. He often seems to want frequentist confidence intervals, but then explains them as Bayesian credible intervals:
https://dynamicecology.wordpress.com/2013/06/25/book-review-the-signal-and-the-noise-by-nate-silver/
Jeremy. Or the reverse: he touts Bayesian inference, but when it comes to his work, he seeks frequentist intervals (i.e., ordinary pollster estimates with margins of error).
That’s more or less what I meant, sorry if I wasn’t clear.
Jeremy Fox’s link https://dynamicecology.wordpress.com/2013/06/25/book-review-the-signal-and-the-noise-by-nate-silver/
discusses Silver’s book. Here are some snippets from Jeremy’s blog:
“Throughout the book, Silver himself adopts what’s clearly a frequentist notion of “probability” as an objective feature of the world. By “probability” Silver means how often something happens in a long series of trials. For instance, he praises weather forecasters because, in the long run, it rains X% of the time when they say there’s a X% chance of rain. What Silver means by “Bayesian” is “using Bayes’ Theorem”, but he doesn’t seem to realize that one can do that quite happily in many contexts while retaining a frequentist notion of probability. Silver’s general explication of Bayes’ Theorem and why it is useful is couched in terms of subjective or “epistemic” probability (though he doesn’t use that term), probability as measure not of the world but of our uncertainty (lack of knowledge) about the world. This is unfortunate because in practice that’s not actually the definition of probability that he himself uses. You’d think from his general explication of Bayes’ Theorem that Silver cares about subjective Bayesian credible intervals–but it’s clear from the specific case studies he discusses that he actually cares about frequentist confidence intervals. …
Silver makes the mistake, unfortunately all too common among certain sorts of Bayesians, of identifying “frequentist” with “mistaken or unhelpful applications of classical frequentist null hypothesis tests”. That is, he identifies all of frequentist statistics with the worst examples of it. This is unfair on multiple grounds. ……
So Silver here is doing the equivalent of criticizing a car because it can’t fly. ….Not sure why Silver identifies frequentism with the worst of frequentism, and Bayesianism with the best of Bayesianism, but he does.
Silver blames a focus on frequentist null hypothesis testing for many problems in scientific practice that just have nothing to do with that, and that would not be fixed if tomorrow everybody adopted Silver’s preferred methods. Most published research findings are false not because of null hypothesis testing, but because of publication biases, and because of all the hidden biases that Silver himself quite rightly identifies and that are not fixed just by using Bayes’ Theorem.”
I agree with all of your points here. It’s too bad that many statisticians feel it’s appropriate to ridicule frequentist tests for precisely these abuses. The danger is that they’ll be left with methods that lack error control. Of course anyone following this blog knows I’ve said all these things quite a lot.
He is only talking about calibration. If he makes 100 predictions, his model is well calibrated if he gets it right 80% of the time (the “confidence” level).
I agree with Deborah, to me ‘above it 10 percent of the time, and below it 10 percent of the time’ does not make any sense. Furthermore this ‘frequentist’ statement can’t be related to any repeated experiments. Credible intervals do not predict the results of further experiments, they quantify the degree of belief about the true effect (the results at the day of the election). To me the only reasonable explanation is that he is 80% confident that the final result will be in that range.
Paolo: So you’re saying he’s falling into the misinterpretation of CIs that his glossary warns against.
“he’s falling into the misinterpretation of CIs that his glossary warns against”
Looking at what calculation he actually has performed it seems to me that he has rather misrepresented his credible intervals as confidence intervals.
Well essentially yes.I don’t think Ramusab’s comment below is 100% correct because the correct interpretaton of a confidence interval is different as explained in the post. Nate’s interpretation looks like a strange mix.
That’s ridiculous, bayesians check the calibration of their posteriors all the time.
I think what he means is that it’s a credible interval but “if it’s calibrated” it will have the right frequentist coverage. He hasn’t given any justification for why it would be calibrated. It wasn’t stated really clearly, but for the vast majority of his audience it makes no difference.
It’s very common among people who use Bayesian statistics to care about the frequentist performance of their Bayesian procedures.
Anon: But it’s unclear what the performance is. Is it about the fixed interval (varying parameter values) or the method of interval estimation? His claim does hold if the observed mean were to equal the true population mean, then it’s just a claim about how much the observed % varies from the population value–and how often– in repeated samples from the population with known mean.
Here’s something in connection with the recent outlier poll on Trump. It’s of relevance only in illustrating that pollsters do generally interpret confidence intervals in the standard (correct) way. http://www.huffingtonpost.com/arnold-steinberg/cbs-poll-vs-wsj-nbc-poll_b_9264952.html
“In theory, one out of twenty times (that is, with a 95 percent confidence interval common in such polling), the results could be an outlier off by more then the margin of error. I polled for more than three decades and almost never had an outlier. In all that time, my surveys were either on the mark or very close. It is not a matter of statistics, it is a matter of dong it right and controlling for NON-sampling error.”