
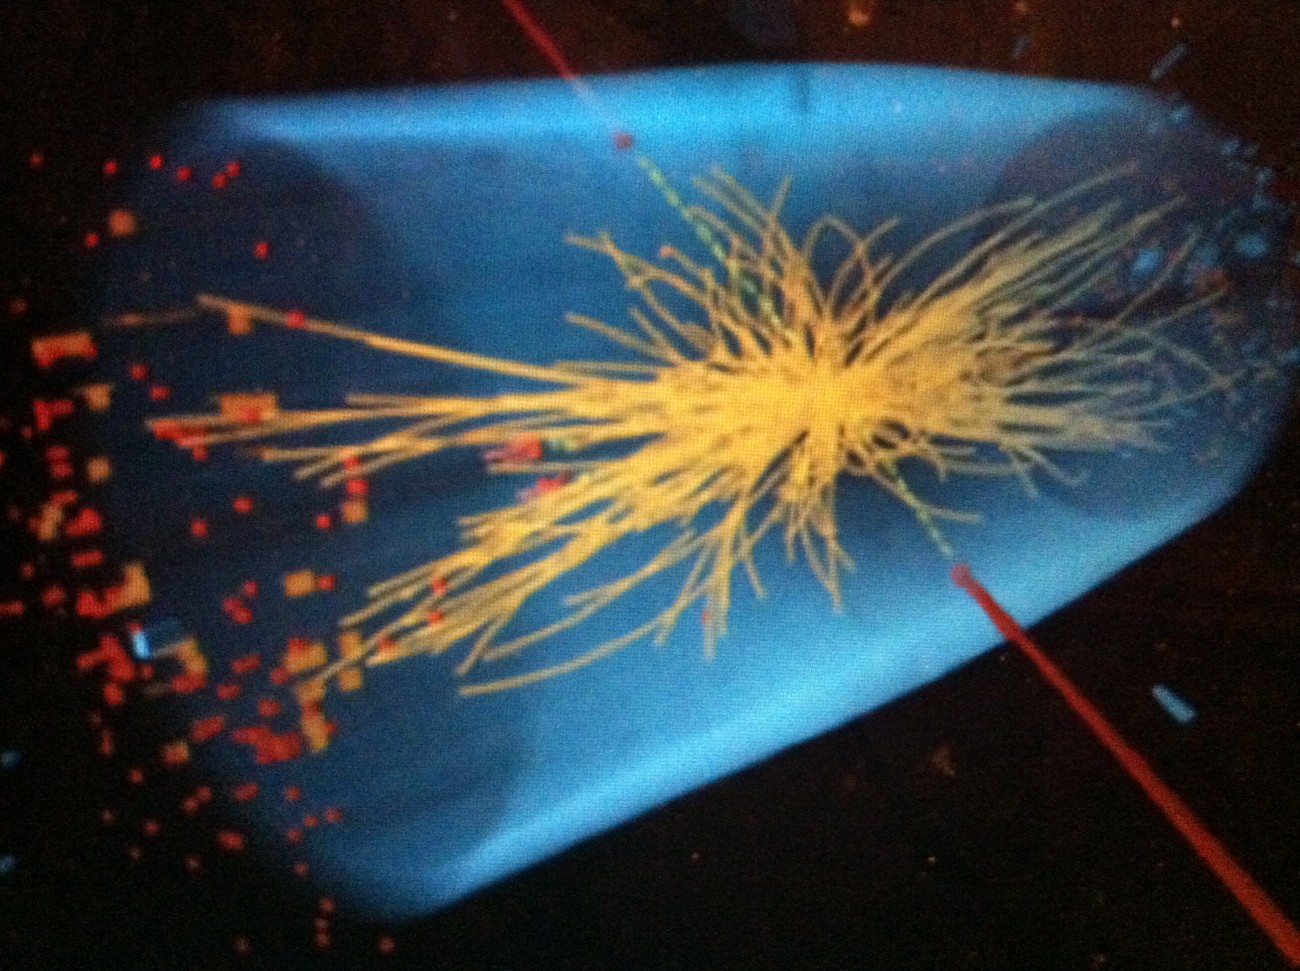
Higgs
Today marks a decade since the discovery on July 4, 2012 of evidence for a Higgs particle based on a “5 sigma observed effect”. CERN celebrated with a scientific symposium (webcast here). The observed effect refers to the number of excess events of a given type that are “observed” in comparison to the number that would be expected from background alone—which they can simulate in particle detectors. Because the 5-sigma standard refers to a benchmark from frequentist significance testing, the discovery was immediately imbued with controversies that, at bottom, concerned statistical philosophy.
Just a few days after the big Higgs announcement in 2012, murmurings could be heard among some Bayesian statisticians as well as in the popular press. Why a 5-sigma standard? Do significance tests in high-energy particle (HEP) physics escape the misuses of P values found in the social sciences and other sciences? While the world of physics was toasting the great discovery, there were grumblings back at the International Society of Bayesian Analysis (ISBA), raised by a leading subjective Bayesian Dennis Lindley. A letter that was being sent around to the ISBA list was leaked to me, written by statistician Tony O’Hagan. “Dear Bayesians,” the letter began, “A question from Dennis Lindley prompts me to consult this list in search of answers. We’ve heard a lot about the Higgs boson.”
Why such an extreme evidence requirement? We know from a Bayesian perspective that this only makes sense if (a) the existence of the Higgs boson . . . has extremely small prior probability and/or (b) the consequences of erroneously announcing its discovery are dire in the extreme. (O’Hagan 2012) [1]
Neither of these seemed to be the case in his opinion: “Is the particle physics community completely wedded to frequentist analysis? If so, has anyone tried to explain what bad science that is?” (O’Hagan 2012).
Bad science? It is not bad science at all. In fact, HEP physicists are sophisticated with their statistical methodology—they had seen too many bumps disappear. They want to ensure that before announcing a new particle has been discovered that, at the very least, the results being spurious is given a run for its money. Significance tests, followed by confidence intervals, are methods of choice here for good reason. You can read Lindley’s full letter here.
The last 10 years have been disappointing the HEP physicist community, as they haven’t been able to discover new particles that would knock down the Standard Model (SM) to yield physics beyond the SM, i.e., BSM physics. It is presumed there must be some BSM, given SM’s limits in explaining gravity and dark matter. Yet the Higgs particle that was discovered in 2012 continues to look like a plain-vanilla SM Higgs. In each inquiry, described as “in search for” some form of BSM, the SM null hypothesis holds up–despite massive data. While disappointing physicists, this negative role of significance tests is crucial for blocking wrong pathways for developing new physics.
There’s a short Higgs discussion in Tour III in Excursion 3 (pp. 202-217) of my Statistical Inference as Severe Testing: How to Get Beyond the Statistics Wars (2018, CUP). Here’s an excerpt that links the O’Hagan letter to a 2015 update to the search for BSM:
Back to O’Hagan and a 2015/2016 Update
O’Hagan published a digest of responses a few days later. When it was clear his letter had not met with altogether enthusiastic responses, he backed off, admitting that he had only been being provocative with the earlier letter. Still, he declares, the Higgs researchers would have been better off avoiding the “ad hoc” 5 sigma by doing a proper (subjective) Bayesian analysis. “They would surely be willing to [announce SM Higgs discovery] if they were, for instance, 99.99 percent certain” [SM Higgs] existed. Wouldn’t it be better to report
Pr(SM Higgs|data) = 0.9999?
Actually, no. Not if it’s taken as a formal probability rather than a chosen way to abbreviate: the reality of the SM Higgs has passed a severe test. Physicists believed in a Higgs particle before building the big billion dollar collider. Given the perfect predictive success of the SM, and its simplicity, such beliefs would meet the familiar standards for plausibility. But that’s very different from having evidence for a discovery, or information about the characteristics of the particle. Many aver they didn’t expect it to have so small a mass, 125 GeV. In fact, given the unhappy consequences some find with this low mass, some researchers may well have gone back and changed their prior probabilities to arrive at something more sensible (more “natural” in the parlance of HEP). Yet, their strong argument from coincidence via significance tests prevented the effect from going away.
O’Hagan/Lindley admit that a subjective Bayesian model for the Higgs would require prior probabilities to scads of high dimensional “nuisance” parameters of the background and the signal; it would demand multivariate priors, correlations between parameters, joint priors, and the ever worrisome Bayesian catchall factor: Pr(data|not- H*). Lindley’s idea of subjectively eliciting beliefs from HEP physicists is rather unrealistic here.
Now for the update. When the collider restarted in 2015, it had far greater collider energies than before. On December 15, 2015 something exciting happened: “ATLAS and CMS both reported a small ‘bump’ in their data” at a much higher energy level than the Higgs: 750 GeV (compared to 125 GeV) (Cartlidge 2016). “As this unexpected bump could be the first hint of a new massive particle that is not predicted by the Standard Model of particle physics, the data generated hundreds of theory papers that attempt to explain the signal” (ibid.). I believe it was 500.
…Could the Bayesian model wind up in the same place? Not if Lindley/ O’Hagan’s subjective model merely keeps updating beliefs in the already expected parameters. According to Savage, “The probability of ‘something else’ … is definitely very small” (Savage 1962, p. 80). It would seem to require a long string of anomalies before the catchall is made sufficiently probable to start seeking new physics. Would they come up with a particle like the one they were now in a frenzy to explain? Maybe, but it would be a far less efficient way for discovery than the simple significance tests.
It turned out that the promising bump or “resonance” (a great HEP term) disappeared as more data became available, drowning out the significant indications seen in April. Its reality was falsified. The null hypothesis correctly explains the data. While disappointing to physicists, this negative role of significance tests is crucial for for denying BSM anomalies are real, and setting upper bounds for these discrepancies with the SM Higgs.
Tomorrow, Run 3 begins with a much more powerful collider, and physicists are optimistic!
HAPPY JULY 4, AND HAPPY HIGG’S DISCOVERY DAY.
Selected earlier blogposts on the Higgs Discovery:
- August 20, 2012: Higgs Boson: Bayesian “Digest and Discussion”
- August 22, 2012: Scalar or Technicolor? S. Weinberg, “Why the Higgs?”
- August 25, 2012: “Did Higgs Physicists Miss an Opportunity by Not Consulting More With Statisticians?”
- March 17, 2013: Update on Higgs data analysis: statistical flukes (part 1)
- March 27, 2013: Higgs analysis and statistical flukes (part 2)
- April 29, 2013: What should philosophers of science do? (Higgs, statistics, Marilyn)
- Nov 9, 2014: “Statistical Flukes, the Higgs Discovery, and 5 Sigma” at the PSA
Mayo, D. (2018). “Experimental Flukes and Statistical Modeling in the Higgs Discovery,” in Isabelle Peschard and Bas van Fraassen (eds.), The Experimental Side of Modeling in Minnesota Studies in the Philosophy of Science, University of Minnesota Press, 189-217.


")


There is a saying, appended to philosophy. It talks of making a difference, that makes a difference. The Higgs particle, if it is one, was long-anticipated. Now, we hope for a result. As a pragmatist, I do.
Thank you for reminding us of the 5 sigma P value that was used in support of evidence for the existence of the Higgs Boson.I gather that the above ‘5 sigma’ corresponded to a two sided P value of about 0.00000059 or a one-sided P value of 0.0000003. This suggests to me that in the case of the Higgs Boson data, the probability is 1- 0.0000003 = 0.9999997 that the study result would be ‘replicated’ by being greater than the null hypothesis if an infinite number of observations were made to get the ‘true’ result. A one-sided P value of 0.0000003 also means that the observed mean result was 4.995 SEMs away from the null hypothesis. According to my understanding, if the experiment was repeated in exactly the same way, then the probability of getting a P value of 0.025 one sided or less the second time would be 0.94. The reasoning that led me to arrive at the above conclusions is as follows.
If the estimation was based on a Gaussian distribution of continuous variables then the prior probability of the possible true values and the possible observed values conditional on the universal set of continuous numbers would be uniform and the same for the possible observed and possible true values. We can therefore assume that the probability of a possible true value conditional on an observed value is equal to the likelihood of the same possible observed value conditional on the same true value. Therefore the probability of the true value being the same or more extreme than the null hypothesis conditional on the observed study result is equal to the P value and that the probability of the true value being less extreme than the null hypothesis is equal to 1-P.
Instead of repeating the study with an infinite number of observations, if it were repeated with only the same number of observations then the variance of the observations would depend on two separate groups of observations and would be twice as great, the SEM being √2 = 1.1414 as great. The null hypothesis would now be 4.9950/1.1414 = 3.532 SEMs away from the null hypothesis. The probability of replication greater than the null hypothesis would now be lower at 0.998. However, if we expected to get a P value of 0.025 or less for the repeat study, then the second result would have to be 1.96 SEMs (i.e. an effect size of 1.96 SEMs) or more away from the null hypothesis at 3.532-1.960 = 1.572. The latter corresponds to a probability of replication of 0.94. Note that if the original P value had been 0.025, then the above calculation provides a probability of replication with a P value of 0.025 or less would only be 0.28. This corresponds to the ball park replication frequency of 36% found in replication studies [1].
Perhaps the best thing to do is take a ‘long view’ by expressing the probability of replication as the theoretical probability of a result falling within a specified range (e.g. less extreme than the null hypothesis) if the study was repeated with an infinite number of observations. This still leaves the question of what level of ‘long term replication’ should constitute a ‘statistically significant’ result. According to current custom it would be a probability of 0.975 for a one sided P value of 0.025 and a prediction interval of 95% for two sided P values.
A Bayesian prior probability is not conditional only on the universal set but also on personal informal evidence. In this sense a Bayesian prior is a posterior probability based on a personally estimated likelihood distribution and a uniform prior distribution conditional on the universal set of all continuous numbers. The second prior is then combined with another likelihood distribution based on data to create a second posterior distribution. The frequentist parallel is to combine two data sets based on identical methods by calculating their weighted mean and variance or calculating the product of their likelihoods at each baseline value and normalising [2]. The latter is also based on assumption of uniform priors, which is also made when calculating 95% prediction intervals. However, if a test result is based on the mean of several measurements then SEMs will be used to calculate prediction intervals, in the same way as they are used to calculate confidence intervals.
References
1. Open Science Collaboration (2015) Estimating the reproducibility of psychological science. Science; 349 (6251):aac4716.0
2. Llewelyn H (2019) Replacing P-values with frequentist posterior probabilities of replication—When possible parameter values must have uniform marginal prior probabilities. PLoS ONE 14(2): e0212302. https://doi.org/10.1371/journal.pone.0212302s