
.
The biennial meeting of the Philosophy of Science Association (PSA) starts this week (Nov. 6-9) in Chicago, together with the History of Science Society. I’ll be part of the symposium:
Summary
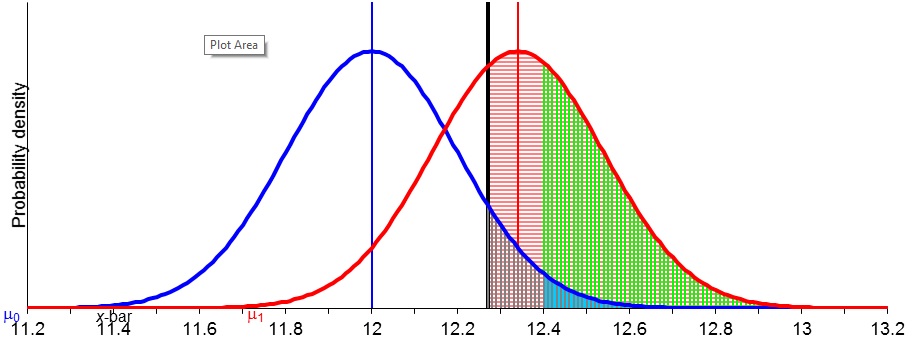
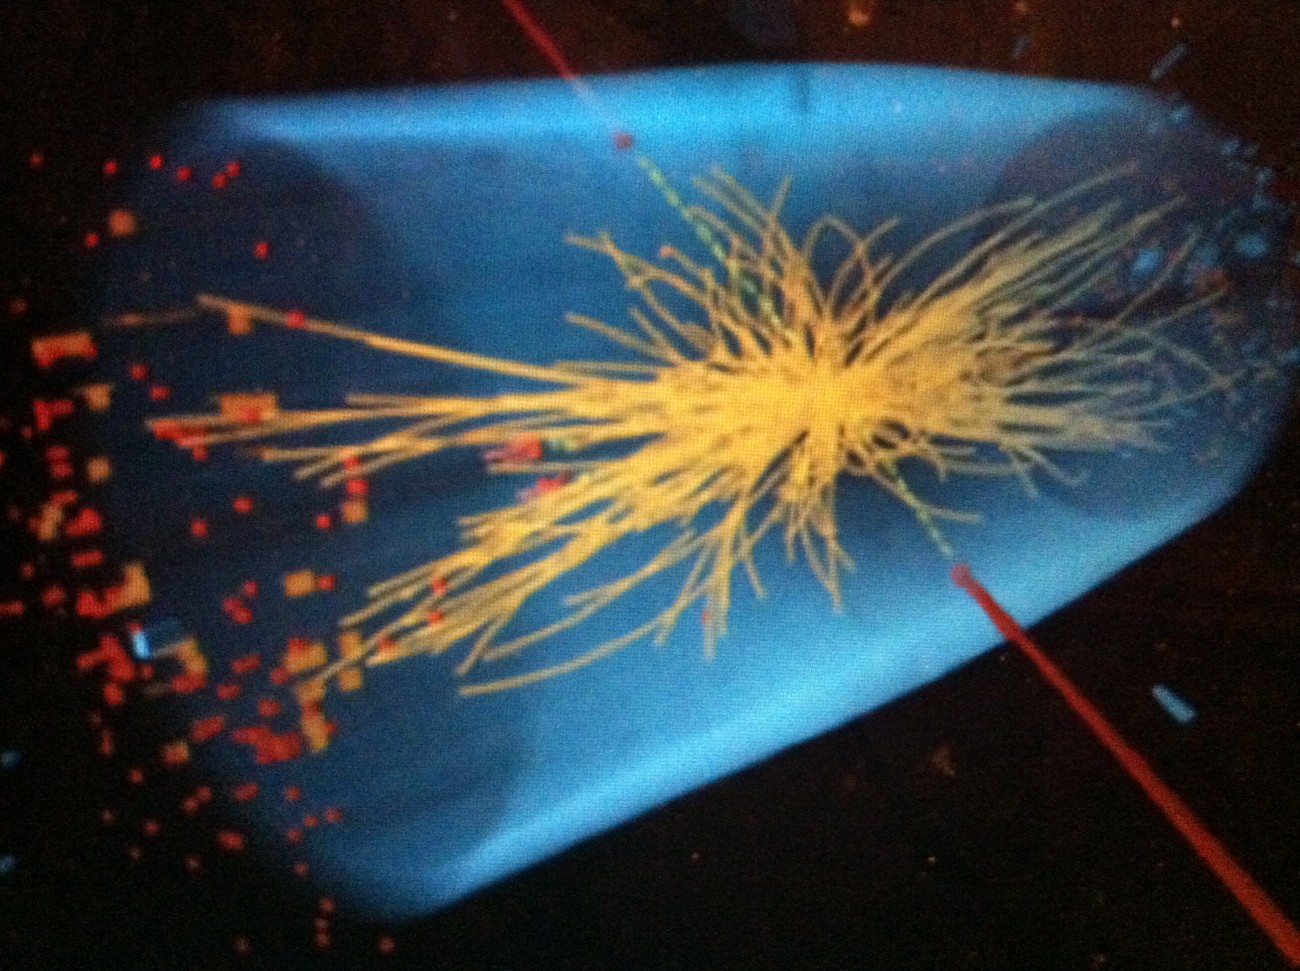
“A 5 sigma effect!” is how the recent Higgs boson discovery was reported. Yet before the dust had settled, the very nature and rationale of the 5 sigma (or 5 standard deviation) discovery criteria began to be challenged and debated both among scientists and in the popular press. Why 5 sigma? How is it to be interpreted? Do p-values in high-energy physics (HEP) avoid controversial uses and misuses of p-values in social and other sciences? The goal of our symposium is to combine the insights of philosophers and scientists whose work interrelates philosophy of statistics, data analysis and modeling in experimental physics, with critical perspectives on how discoveries proceed in practice. Our contributions will link questions about the nature of statistical evidence, inference, and discovery with questions about the very creation of standards for interpreting and communicating statistical experiments. We will bring out some unique aspects of discovery in modern HEP. We also show the illumination the episode offers to some of the thorniest issues revolving around statistical inference, frequentist and Bayesian methods, and the philosophical, technical, social, and historical dimensions of scientific discovery.
Questions:
1) How do philosophical problems of statistical inference interrelate with debates about inference and modeling in high energy physics (HEP)?
2) Have standards for scientific discovery in particle physics shifted? And if so, how has this influenced when a new phenomenon is “found”?
3) Can understanding the roles of statistical hypotheses tests in HEP resolve classic problems about their justification in both physical and social sciences?
4) How do pragmatic, epistemic and non-epistemic values and risks influence the collection, modeling, and interpretation of data in HEP?
Abstracts for Individual Presentations
 (1) Unresolved Philosophical Issues Regarding Hypothesis Testing in High Energy Physics
Robert D. Cousins.
Professor, Department of Physics and Astronomy, University of California, Los Angeles (UCLA)
The discovery and characterization of a Higgs boson in 2012-2013 provide multiple examples of statistical inference as practiced in high energy physics (elementary particle physics). The main methods employed have a decidedly frequentist flavor, drawing in a pragmatic way on both Fisher’s ideas and the Neyman-Pearson approach. A physics model being tested typically has a “law of nature” at its core, with parameters of interest representing masses, interaction strengths, and other presumed “constants of nature”. Additional “nuisance parameters” are needed to characterize the complicated measurement processes. The construction of confidence intervals for a parameter of interest q is dual to hypothesis testing, in that the test of the null hypothesis q=q0 at significance level (“size”) a is equivalent to whether q0 is contained in a confidence interval for q with confidence level (CL) equal to 1-a. With CL or a specified in advance (“pre-data”), frequentist coverage properties can be assured, at least approximately, although nuisance parameters bring in significant complications. With data in hand, the post-data p-value can be defined as the smallest significance level a at which the null hypothesis would be rejected, had that a been specified in advance. Carefully calculated p-values (not assuming normality) are mapped onto the equivalent number of standard deviations (“s”) in a one-tailed test of the mean of a normal distribution. For a discovery such as the Higgs boson, experimenters report both p-values and confidence intervals of interest. Continue reading


")


Power taboos: Statue of Liberty, Senn, Neyman, Carnap, Severity
My fire alarm analogy is here. My analogy presumes you are assessing the situation (about the fire) long distance. Continue reading →